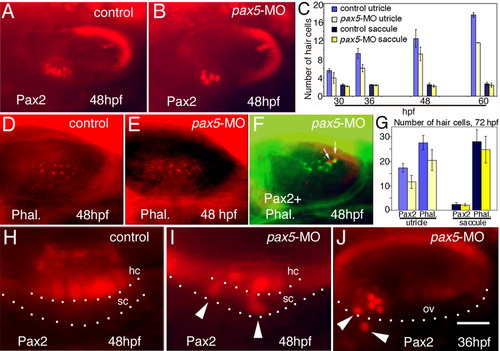
Assessment of hair cell development. A,B: Anti-Pax2 staining in the otic vesicle in a control embryo (A) and pax5 morphant (B) at 48 hours postfertilization (hpf). C: Number of Pax2+ hair cells at the indicated stages (means and standard errors of at least three experiments, with at least 15 specimens/time-point/experiment). P values for the comparison of control embryos vs. pax5 morphants are as follows: utricle, P = 0.042 (30 hpf), P = 0.009 (36 hpf), P = 0.0007 (48 hpf), P = 0.017 (60 hpf); and saccule, P = 0.136 (30 hpf), P = 0.138 (36 hpf), P = 0.05 (48 hpf), P = 0.28 (60 hpf). D,E: Rhodamine-phalloidin staining in the saccular macula of a control embryo (D) and pax5 morphant (E) at 48 hpf. In control embryos (n = 23), there were 21.5 ± 5.0 hair cells in the utricular macula and 17.8 ± 9.7 in the saccular macula. In pax5 morphants (n = 42), there were 16.8 ± 4.5 hair cells in the utricle and 14.8 ± 7.5 in the saccule. F: Saccular maculae stained with anti-acetylated tubulin (green) and anti-Pax2 (red) in a pax5 morphant at 48 hpf. Only two hair cells are Pax2-positive (arrows). G: Hair cell numbers detected by anti-Pax2 or phalloidin staining in pax5 morphants and uninjected controls at 72 hpf. Data bars are color-coded as in C. H,I: Enlarged view of the utricular macula stained with anti-Pax2 at 48 hpf in a control embryo (H) and pax5 morphant (I). Basal edges of hair cell (hc) and supporting cell (sc) layers are indicated. J: Otic vesicle of pax5 morphant stained with anti-Pax2 at 36 hpf. Arrowheads mark misplaced hair cells. The ventral limit of the otic vesicle (ov) is indicated. Images show dorsolateral (A,B,D-F,J) and lateral (H,I) views with anterior to the left. Scale bar = 40 μm in A,B,D-F, 12.5 μm in H,I, 25 μm in J.
|
