
Fig. 4
- ID
- ZDB-FIG-060922-4
- Publication
- Pujic et al., 2006 - Reverse genetic analysis of neurogenesis in the zebrafish retina
- Other Figures
- All Figure Page
- Back to All Figure Page
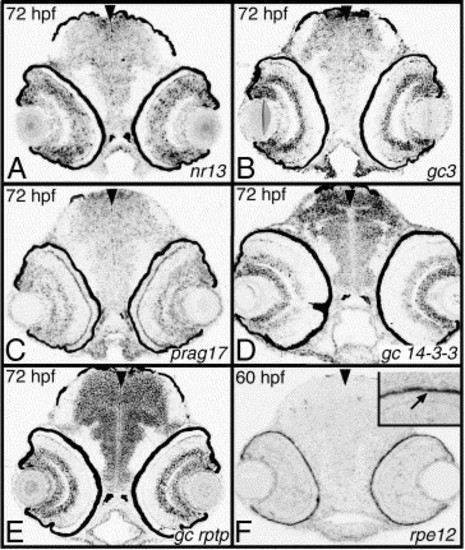
Transcripts expressed in multiple cell layers or RPE. (A) nr13 is expressed in all layers with exception of photoreceptor cells. (B) gc3 expression is mostly detectable in the inner nuclear layer and in ganglion cells. (C) prag17 transcript is enriched in the vicinity of the outer plexiform layer and in the inner retina. (D) gc 14-3-3 is expressed in the ganglion cell layer and in amacrine cells at a somewhat lower level. (E) gc rptp is expressed at approximately the same level in both GCL and the inner portion of INL, most likely in amacrine cells. (F) rpe12 is expressed in the retinal pigment epithelium. The expression pattern of each clone is shown at one time point, indicated in the upper left corner of each panel. Transcripts were analyzed on plastic sections following whole-embryo in situ hybridization. To block RPE pigmentation, embryo in panel F was treated with PTU. Arrowheads mark the midline. hpf, hours postfertilization; prcl, photoreceptor cell layer; inl, inner nuclear layer; gcl, ganglion cell layer. |
| Genes: | |
|---|---|
| Fish: | |
| Anatomical Terms: | |
| Stage Range: | Pec-fin to Protruding-mouth |
Reprinted from Developmental Biology, 293(2), Pujic, Z., Omori, Y., Tsujikawa, M., Thisse, B., Thisse, C., and Malicki, J., Reverse genetic analysis of neurogenesis in the zebrafish retina, 330-347, Copyright (2006) with permission from Elsevier. Full text @ Dev. Biol.