
Fig. 1
- ID
- ZDB-FIG-060921-5
- Publication
- Pujic et al., 2006 - Reverse genetic analysis of neurogenesis in the zebrafish retina
- Other Figures
- All Figure Page
- Back to All Figure Page
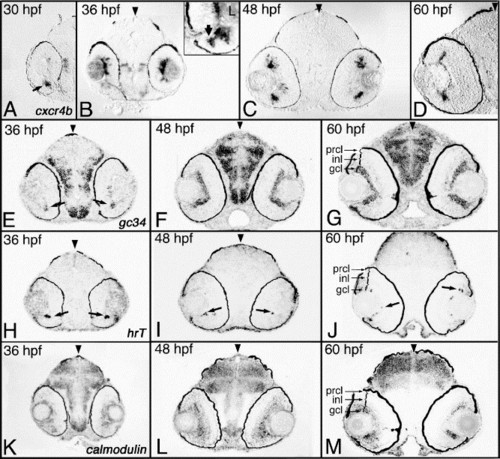
Transcripts predominantly expressed in the GCL. Shown are examples of cDNAs expressed in the ganglion cell layer. (A–D) Expression of cxcr4b between 30 and 60 hpf. (E–G) Expression of the gc34 gene between 36 and 60 hpf. (H–J) Expression of hrT between 36 and 60 hpf. (K–M) Expression of the calmodulin gene between 36 and 60 hpf. Expression was studied on plastic sections following whole-embryo in situ hybridization. Arrowheads mark the midline. Arrows indicate individual cells or small groups of cells that feature expression of particular transcripts. hpf, hours postfertilization; prcl, photoreceptor cell layer; inl, inner nuclear layer; gcl, ganglion cell layer. |
| Genes: | |
|---|---|
| Fish: | |
| Anatomical Terms: | |
| Stage Range: | Prim-15 to Pec-fin |
Reprinted from Developmental Biology, 293(2), Pujic, Z., Omori, Y., Tsujikawa, M., Thisse, B., Thisse, C., and Malicki, J., Reverse genetic analysis of neurogenesis in the zebrafish retina, 330-347, Copyright (2006) with permission from Elsevier. Full text @ Dev. Biol.