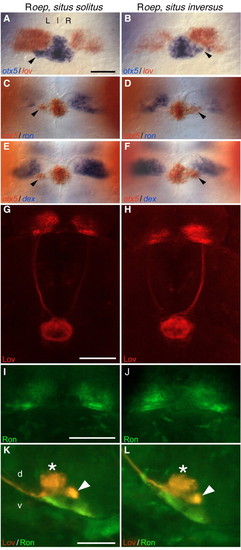
Lov and Ron distribution reflects directional asymmetry of habenulae. (A,C,E) Approximately 50% of Roep larvae show directional asymmetry of the epithalamus similar to WT (situs solitus), with a left-positioned parapineal, expanded lov (n=17/41) and reduced ron (n=13/24) and dex (n=10/25) expression in the left habenula. (B,D,F) Remaining Roep larvae show mirror image reversal (situs inversus) in parapineal position and habenular gene expression patterns. (A-F) Parapineal position (arrowhead) was confirmed by otx5 expression (Gamse et al., 2002). Dorsal views, anterior to top; scale bar: 50 µm. (G,H) Lov protein levels are higher in left habenula and FR of WT larvae (see Fig. 2) and half of Roep larvae (G; n=39/70). The other Roep larvae show a L-R reversal in Lov immunofluorescence (H; n=31/70). (I,J) Ron immunofluorescence is expanded in WT right habenula (see Fig. 2) and in half of Roep larvae (I; n=39/70). In L-R reversed Roep larvae, the Ron+ domain is expanded on the left (J; n=31/70). G-J are confocal Z-stacks from the dorsal aspect, anterior to top; scale bars: 40 µm. (K) In Roep larvae with a WT pattern of habenular asymmetry, Lov+ and Ron+ efferents project to dorsoventral and ventral IPN domains, respectively. (L) In L-R reversed larvae, projections along the DV axis of IPN are maintained, although Lov+ and Ron+ efferents emerge from the opposite side of the brain. (K,L) Confocal Z-stacks from the lateral aspect, anterior to left. Asterisk and arrowhead indicate anterior and posterior domains of dorsal IPN. Scale bar: 30 µm.
|
