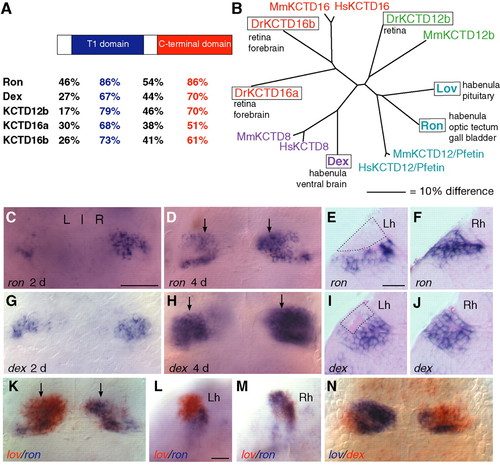
leftover (lov)-related genes are asymmetrically expressed in zebrafish diencephalon. (A) Five zebrafish proteins, Right on (Ron), Dexter (Dex), and Potassium channel tetramerization domain-containing proteins 12b (Kctd12b), 16a and 16b, are structurally similar to Lov (% amino acid identity indicated), contain an N-terminal T1 domain related to the tetramerization domain of the Shaker potassium channel (blue box) and a conserved C-terminal domain (red box) (see Gamse et al., 2003). (B) Zebrafish Lov-related family members (boxed) and homologous mammalian proteins fall into four major groups (designated by colors). The unrooted phylogenetic tree was calculated using the CLUSTAL_X algorithm (Thompson et al., 1997). Scale bar indicates a 10% difference in amino acid identity, measured along the shortest path between two proteins. Dr, Danio rerio; Mm, Mus musculus; Hs, Homo sapiens. (C,D,G,H) Asymmetric expression of (C) ron and (G) dex in habenular nuclei is detected at 2 days, and increases significantly by 4 days (D,H). Parasagittal sections through (E,I) left (Lh) and (F,J) right (Rh) habenulae reveal ron and dex transcripts throughout Rh, but confined to more ventral regions of Lh (dorsal regions outlined in E and I). (K-M) Double in situ hybridization shows lov and ron DV expression is largely non-overlapping in Lh (L) but coextensive in Rh (M). (N) dex habenular expression partially overlaps with lov, although most dex-expressing cells in Lh are more ventral than lov-expressing cells. C,D,G,H,K and N are dorsal views with anterior to the top; scale bar: 50 µm. Left (L) and right (R) sides of the brain and midline, indicated in C, apply to all dorsal views. Arrows in D,H and K indicate approximate position of sections shown in subsequent panels. E,F,I and J are parasagittal plastic sections (8-10 µm) with dorsal to the top and anterior to the left; scale bar: 20 µm. L and M are vibratome sections (100 µm) with dorsal to the top and anterior to left; scale bar: 30 µm.
|
