
FIGURE
Fig. 5
Fig. 5
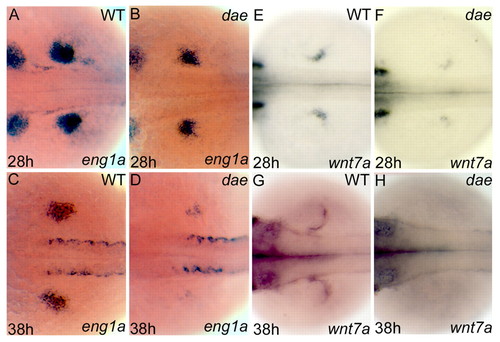
Expression of DV axis markers is disrupted in fgf10/dae. Dorsal views of in situ hybridisation staining of wild-type (A,C,E,G) and fgf10/dae (B,D,F,H) embryos. Expression of all genes analysed appears slightly reduced at 28 hpf in fgf10/dae (B,F) when compared with siblings (A,E). By 38 hpf, eng1a expression is severely reduced (D) and wnt7a expression (H) is absent in fgf10/dae. |
Expression Data
| Genes: | |
|---|---|
| Fish: | |
| Anatomical Terms: | |
| Stage Range: | Prim-5 to Prim-25 |
Expression Detail
Antibody Labeling
Phenotype Data
Phenotype Detail
Acknowledgments
This image is the copyrighted work of the attributed author or publisher, and
ZFIN has permission only to display this image to its users.
Additional permissions should be obtained from the applicable author or publisher of the image.
Full text @ Development