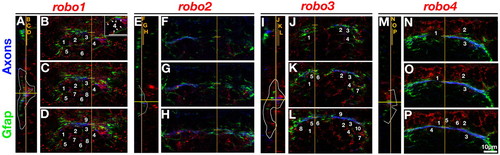
Single slice confocal analysis of Robo expression (red) in relation to axons (anti-AT, blue) and glial cells (anti-Gfap, green) in the POC/chiasm region. (A,E,I,M) Sagittal slice of anterior forebrain, anterior to the left with the POC/chiasm region outlined in white. Lettered orange lines show the positions of accompanying sections. (B-D) Frontal views of the POC/chiasm region displayed in consecutive 0.4 μm slices from superficial (B) to deep (D). Vertical and horizontal orange lines denote the location of the sagittal section in A. robo1 expression directly overlaps with Gfap+ fibers (A, outlined area; B-D, numbered nuclei). Inset in B shows a higher magnification of cell #4, arrowheads point to overlapping expression of robo1 and gfap. (F-H) Single slices separated by 0.8 μm. robo2 is expressed exclusively below Gfap+ cells (E, white line denotes separation between Gfap+ fibers and robo2 expression). (J-L) Single slices separated by 1.2 μm. robo3 expression directly overlaps with Gfap+ fibers in the POC/chiasm region (I, outlined area; J-L, numbered nuclei). (M-P) Single slices separated by 0.8 μm. Only the anterior subset of Gfap+ cells overlaps with robo4 expression (M, top bracket; N-P, numbered nuclei). Scale bar: 10 μm. Nuclei of Robo/Gfap co-expressing cells are numbered in all frontal views.
|
