FIGURE SUMMARY
Title

Lactobacillus rhamnosus GG triggers intestinal epithelium injury in zebrafish revealing host dependent beneficial effects

Authors
Zhang, Z., Zhang, H.L., Yang, D.H., Hao, Q., Yang, H.W., Meng, D.L., Meindert de Vos, W., Guan, L.L., Liu, S.B., Teame, T., Gao, C.C., Ran, C., Yang, Y.L., Yao, Y.Y., Ding, Q.W., Zhou, Z.G.
Source
Full text @ Imeta

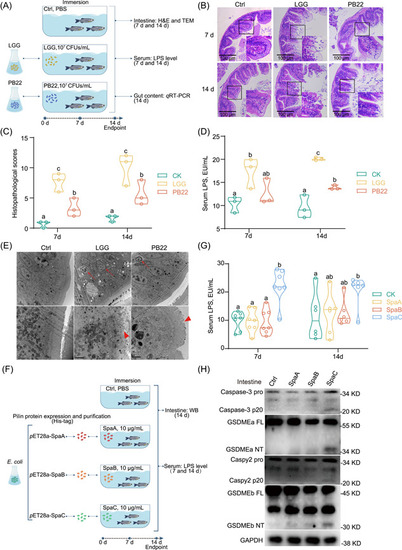
SpaC pilin subunit is responsible for zebrafish intestinal mucosa damage. (A) One‐month old zebrafish were immersed with either LGG or PB22 at 107 CFUs/mL for 7 or 14 days. (B) Representative intestinal histology images by H&E staining. Scale bar 100 μm. (C) Total histological score measuring the severity of the intestinal injury at 7 and 14 days (Day 7: F2,6 = 16.545; Day 14: F2,6 = 13.971; n = 3). Quantitative data was obtained by the indicators including: disorganized microvilli, edema or inflammatory infiltrate in lamina propria, vacuolar degeneration of IECs, cell shedding and necrosis. (D) Serum LPS levels (Day 7: F2,6 = 5.185; Day 14: F2,6 = 37.515; n = 3, pool of three zebrafish per sample). (E) Representative electron micrographs of intestinal sections at Day 14. Scale bar 2 μm (up). Scale bar 1 μm (below). Arrows indicate dying or dead intestinal epithelial cells. Triangular arrows indicate microvilli damage. (F) One‐month old zebrafish were immersed with recombinant SpaA, SpaB, or SpaC at concentrations of 10 μg/mL for Day 7 or 14, respectively. (G) Serum LPS levels (Day 7: F3,24 = 13.562; Day 14: F3,20 = 2.543; n = 6 or 7, pool of 3 zebrafish per sample). (H) A representative western blot analysis showing Caspase‐3 activation, GSDMEa cleavage, Caspy2 activation and GSDMEb cleavage. Numbers of biologically independent samples are labeled on the violin plots. Horizontal line represents median in the violin plots. Statistics: one‐way ANOVA followed by Duncan's test. Treatments in plots labeled with different letters on top represent statistically significant results (p < 0.05). Caspase, cysteinyl aspartate specific proteinase; CFUs, colony forming units; GSDM, gasdermin; H&E, Hematoxylin and eosin; IECs, intestinal epithelial cells; LGG, Lactobacillus rhamnosus GG; LPS, lipopolysaccharide.

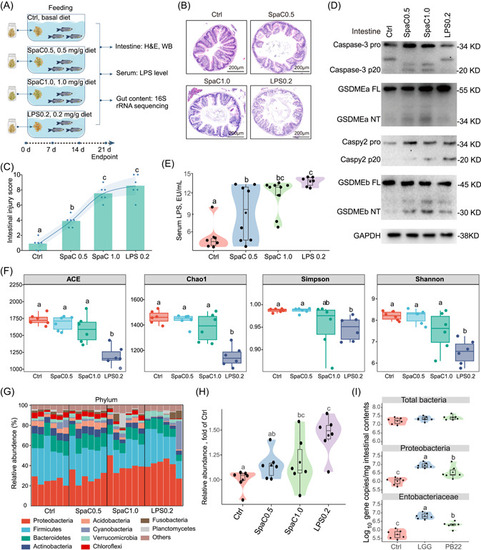
Dietary SpaC and LPS induce intestinal pyroptosis and gut microbial dysbiosis in zebrafish. (A) One‐month old zebrafish were fed with diets supplemented with 0.5 and 1.0 mg/g SpaC or diet supplemented with 0.2 mg/g LPS for three weeks. (B) Representative intestinal histology images by H&E staining. (C) Total histological score measuring the severity of the intestinal injury (Values are means. F3,20 = 65.490; n = 6). (D) A representative western blot analysis showing Caspase‐3 activation, GSDMEa cleavage, Caspy2 activation and GSDMEb cleavage. (E) Serum LPS levels (F3,25 = 9.826; n = 6−9, pool of three zebrafish per sample). (F) Indexes of α diversity (ACE: F3,20 = 17.869; Chao1: F3,20 = 20.649; Simpson: F3,20 = 3.273; Shannon: F3,20 = 11.611; n = 6, pool of 6 zebrafish per sample). (G) The composition of gut microbiota at phylum level (n = 6, pool of six zebrafish per sample). (H) The relative abundance of bacteria producing LPS (F3,20 = 5.907; n = 6). (I) Total number of bacteria (F3,20 = 2.332), the number of Proteobacteria (F3,20 = 18.276) and the number of Entobacteriaceae (F2,14 = 22.373) in the intestinal microbiota of one‐month old zebrafish immersed with either LGG or PB22 at 107 CFUs/mL for Day 14 (n = 5−6). The Numbers of biologically independent samples are labeled on the violin plots. Box represents median ± interquartile range, whiskers represent 1.5× interquartile range. Statistics: one‐way ANOVA followed by Duncan's test. Treatments in violin or box plots labeled with different letters on top represent statistically significant results (p < 0.05).

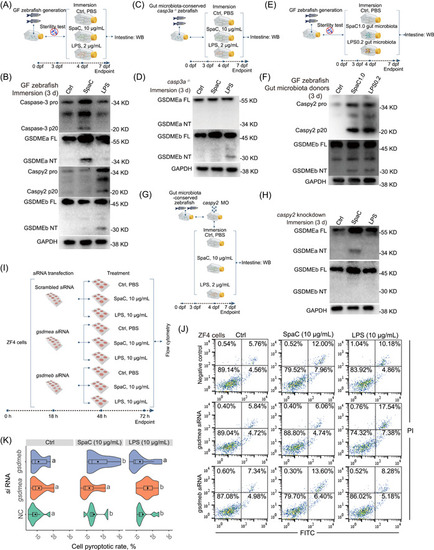
SpaC and LPS induce pyroptosis in gut microbiota‐independent and ‐dependent manners. (A) GF zebrafish (4‐dpf) were immersed with 10 μg/mL SpaC or LPS for 3 d. (B) A representative western blot analysis showing Caspase‐3 activation, GSDMEa cleavage, Caspy2 activation and GSDMEb cleavage in GF zebrafish. (C) The casp3a−/− zebrafish (4‐dpf) were immersed with 10 μg/mL SpaC or LPS for Day 3. (D) A representative western blot analysis showing GSDMEa cleavage and GSDMEb cleavage in casp3a−/− zebrafish. (E) Gut microbiota of zebrafish fed with SpaC or LPS diet was transferred to GF zebrafish for Day 3. (F) A representative western blot analysis showing Caspy2 activation and GSDMEb cleavage in GF zebrafish received the gut microbiota from one‐month old zebrafish fed the SpaC1.0 or LPS0.2 diet for 3 weeks. (G) Zebrafish (4‐dpf) with caspy2 knockdown were immersed with 10 μg/mL SpaC or LPS for Day 3. (H) A representative western blot analysis showing GSDMEa cleavage and GSDMEb cleavage in caspy2 knockdown zebrafish. (I) ZF4 cells were treated with 10 μg/mL SpaC or LPS when gene encoding GSDMEa or GSDMEb were silenced. (J) Representative plots of cell pyroptotic/apoptotic rate. (K) Statistical pyroptotic rates at 24 h posttreatment (Scrambled siRNA: F2,27 = 4.954; gsdmea: F2,27 = 4.067; gsdmeb: F2,27 = 2.449; n = 10). Box represents median ± interquartile range, whiskers represent 1.5× interquartile range in the violin plots. Statistics: Student's t‐test. Treatments in plots labeled with different letters on top represent statistically significant results (p < 0.05). dpf, day postfertilization; GF, germ‐free; siRNA, specific small interfering RNA.

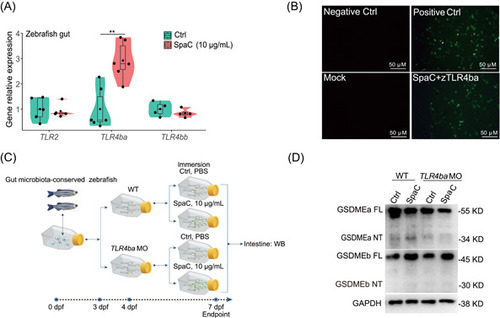
LGG SpaC pilin triggers intestinal pyroptosis by interacting with zebrafish TLR4ba. (A) One‐month old zebrafish were immersed with recombinant SpaC at concentrations of 10 μg/mL for Day 7. The relative mRNA expression of genes encoding TLR2, TLR4ba and TLR4bb in zebrafish intestine as measured by qRT‐PCR (TLR2: F1,8 = 0.116; TLR4ba: F1,10 = 18.075; TLR4bb: F1,6 = 0.912; n = 6). (B) Characterization of the interaction between SpaC and zebrafish TLR4ba by BiFC. (C) The TLR4ba was knocked down by using morpholino oligonucleotides in zebrafish larvae. (D) A representative western blot analysis showing GSDMEa and GSDMEb cleavage in zebrafish larvae with TLR4ba knockdown upon SpaC immersion. The Numbers of biologically independent samples are labeled on the violin plots. Box represents median ± interquartile range, whiskers represent 1.5× interquartile range. Statistics: Student's t‐test. p < 0.01, **. BiFC, bimolecular fluorescent complementation; qRT‐PCR, quantitative real‐time PCR reaction; TLR, toll‐like receptor; Negative Ctrl (nontransfection), mock (cotransfection of pBiFC‐VC155 and pBiFC‐VN173), positive Ctrl (cotransfection of pBiFC‐bFosVC155 and pBiFC‐bjunVN173), experimental group (cotransfection of pBiFC‐VN173‐SpaC and pBiFC‐VC155‐zTLR4ba).

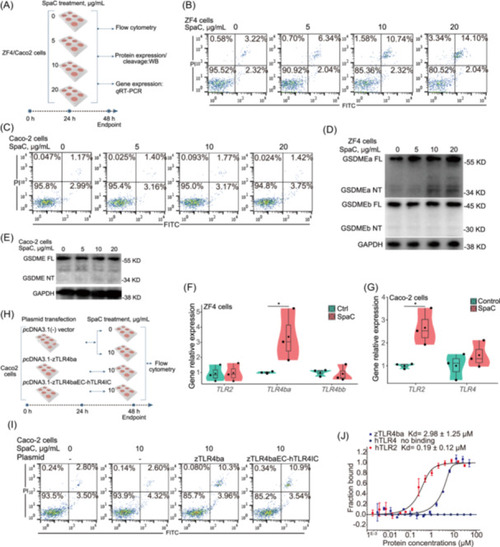
SpaC induces pyroptosis in zebrafish ZF4 cells rather than in human Caco‐2 cells. (A) Cells were treated with increasing concentrations of SpaC (0, 5, 10 and 20 μg/mL) for 24 h. (B) The flow cytometry results of ZF4 cells treated with recombinant SpaC protein in different dose for 24 h. (C) The flow cytometry results of Caco‐2 cells treated with recombinant SpaC protein in different dose for 24 h. (D) A representative western blot analysis showing GSDMEa and GSDMEb cleavage in ZF4 cells. (E) A representative western blot analysis showing GSDME cleavage in Caco‐2 cells. (F) The relative mRNA expression of genes encoding TLR2, TLR4ba and TLR4bb in ZF4 cells (TLR2: F1,4 = 0.024; TLR4ba: F1,4 = 5.550; TLR4bb: F1,4 = 0.062; n = 3). (G) The relative mRNA expression of genes encoding TLR2 and TLR4 in Caco‐2 cells (TLR2: F1,4 = 12.387; TLR4: F1,4 = 0.953; n = 3). (H) Plasmid expressing zTLR4ba or zTLR4baEC‐hTLRIC was transfected into Caco2 cells. (I) The flow cytometry results of Caco‐2 cells or Caco‐2 cells overexpressed zTLR4ba or zTLR4baEC‐hTLRIC treated with 10 μg/mL SpaC protein for 24 h. (J) The strength of interaction (binding affinity) between purified SpaC and TLR proteins was measured by MST technique (n = 3). The Numbers of biologically independent samples are labeled on the violin plots. Box represents median ± interquartile range, whiskers represent 1.5× interquartile range. Statistics: Student's t‐test. p < 0.05, *. MST, MicroScale Thermophoresis; ZF4, zebrafish fibroblast cells; zTLR4ba, zebrafish TLR4ba; zTLR4baEC‐hTLRIC, the fusion of the extracellular domain of zTLR4ba and the transmembrane and intracellular domain of hTLR4.

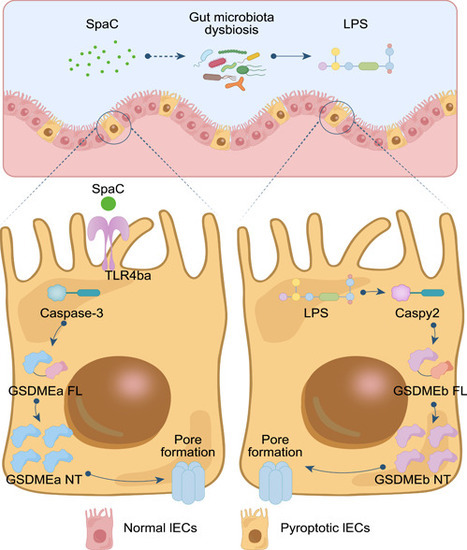
Illustration of the mechanisms underlying the activation of SpaC to intestinal pyroptosis. The SpaC pilin of LGG induces intestinal epithelium injury through a species‐specific activation of TLR4ba, which initiates Caspase‐3−GSDMEa pyroptosis and secondarily activates Gaspy2−GSDMEb pyroptosis via gut microbiota dysbiosis.

Acknowledgments
This image is the copyrighted work of the attributed author or publisher, and ZFIN has permission only to display this image to its users. Additional permissions should be obtained from the applicable author or publisher of the image. Full text @ Imeta