IMAGE

Figure 3

ID
ZDB-IMAGE-240617-37
Source
Figures for Zhang et al., 2024
Image
Figure Caption

Figure 3

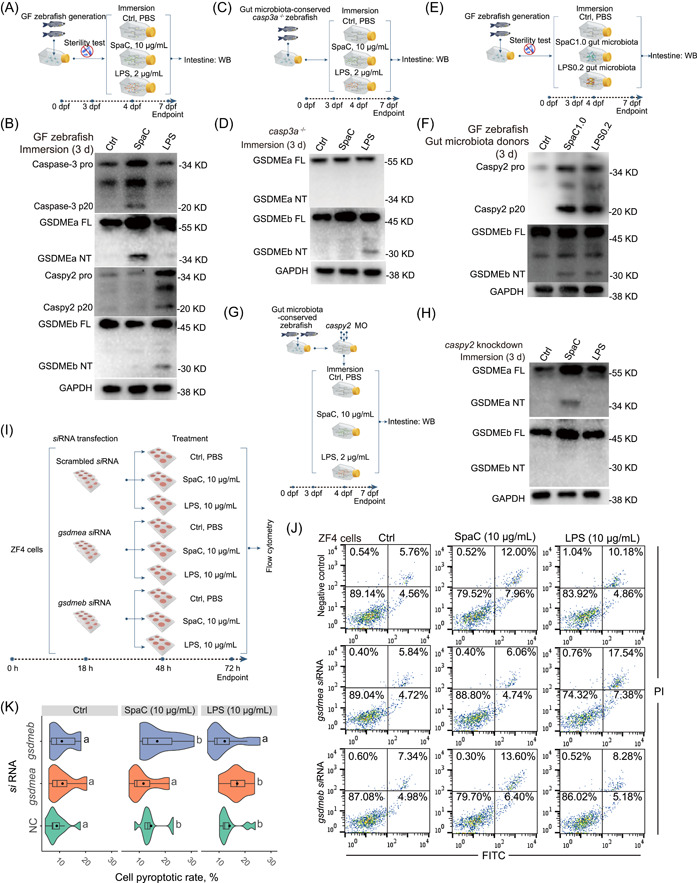
SpaC and LPS induce pyroptosis in gut microbiota‐independent and ‐dependent manners. (A) GF zebrafish (4‐dpf) were immersed with 10 μg/mL SpaC or LPS for 3 d. (B) A representative western blot analysis showing Caspase‐3 activation, GSDMEa cleavage, Caspy2 activation and GSDMEb cleavage in GF zebrafish. (C) The casp3a−/− zebrafish (4‐dpf) were immersed with 10 μg/mL SpaC or LPS for Day 3. (D) A representative western blot analysis showing GSDMEa cleavage and GSDMEb cleavage in casp3a−/− zebrafish. (E) Gut microbiota of zebrafish fed with SpaC or LPS diet was transferred to GF zebrafish for Day 3. (F) A representative western blot analysis showing Caspy2 activation and GSDMEb cleavage in GF zebrafish received the gut microbiota from one‐month old zebrafish fed the SpaC1.0 or LPS0.2 diet for 3 weeks. (G) Zebrafish (4‐dpf) with caspy2 knockdown were immersed with 10 μg/mL SpaC or LPS for Day 3. (H) A representative western blot analysis showing GSDMEa cleavage and GSDMEb cleavage in caspy2 knockdown zebrafish. (I) ZF4 cells were treated with 10 μg/mL SpaC or LPS when gene encoding GSDMEa or GSDMEb were silenced. (J) Representative plots of cell pyroptotic/apoptotic rate. (K) Statistical pyroptotic rates at 24 h posttreatment (Scrambled siRNA: F2,27 = 4.954; gsdmea: F2,27 = 4.067; gsdmeb: F2,27 = 2.449; n = 10). Box represents median ± interquartile range, whiskers represent 1.5× interquartile range in the violin plots. Statistics: Student's t‐test. Treatments in plots labeled with different letters on top represent statistically significant results (p < 0.05). dpf, day postfertilization; GF, germ‐free; siRNA, specific small interfering RNA.

Acknowledgments
This image is the copyrighted work of the attributed author or publisher, and ZFIN has permission only to display this image to its users. Additional permissions should be obtained from the applicable author or publisher of the image. Full text @ Imeta