FIGURE SUMMARY
Title

Synaptic vesicle release regulates pre-myelinating oligodendrocyte-axon interactions in a neuron subtype-specific manner

Authors
Gronseth, J.R., Nelson, H.N., Johnson, T.L., Mallon, T.A., Martell, M.R., Pfaffenbach, K.A., Duxbury, B.B., Henke, J.T., Treichel, A.J., Hines, J.H.
Source
Full text @ Front. Cell. Neurosci.

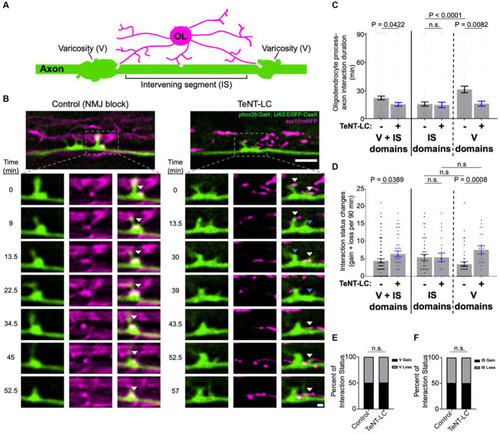
Synaptic vesicle release stabilizes oligodendrocyte interactions at axon varicosities. (A) Diagram illustrates an individual reticulospinal axon (green) and oligodendrocyte (OL) process extensions (magenta). Light pink shapes on the axon represent oligodendrocyte interactions. Axonal domains are segmented into varicosities (V) and intervening segments (IS). (B) Representative time-lapse images show oligodendrocyte-axon interactions over time in control (left) and TeNT-LC-expressing larval zebrafish (3 dpf). Lower inset images are individual timepoints derived from 90 min time-lapse imaging sessions. Transgenic reporter expression of membrane-tethered fluorescent proteins label oligodendrocyte (magenta) and individual reticulospinal axon (green) membranes. White arrows indicate EGFP-mRFP colocalization (interaction sites) and blue arrows denote the location of previous colocalization (retracted interactions). Images are spinal cord lateral views with anterior left and dorsal up; scale bars are 5 μm (upper) and 1 μm (insets). (C) Scatter plot points represent oligodendrocyte-axon interactions and their duration in minutes. Note that for 1 frame durations (1.5 min), for display purposes, an equal number of scatter points are shown above or below the 1.5 min position so all scatter points can be observed. Control IS vs. TeNT IS p = 0.2527. (D) Graph represents the total number of times oligodendrocyte-axon interactions were gained or lost at an individual reticulospinal axon segment across the entire 90 min time-lapse. Control IS vs. TeNT IS p = 0.9994, control V vs. control IS p = 0.1401, TeNT V vs. TeNT IS p = 0.2115. (E) Bar graph shows the percentage of oligodendrocyte process extension interactions at axon varicosities that were gained or lost during the 90 min time-lapse. p > 0.9999. (F) Bar graph shows the percentage of oligodendrocyte process extension interactions at axon intervening segments that were gained or lost during the 90 min time-lapse. p > 0.9999. For panels (C,D), bars represent mean ± SEM; sample size = 80 control and 41 TeNT-LC axon segments analyzed from 28 control and 14 TeNT-LC larvae. Reported p-values were obtained using the Mann–Whitney test (C,D) unpaired t-test (D), or Fisher’s exact test (E,F).

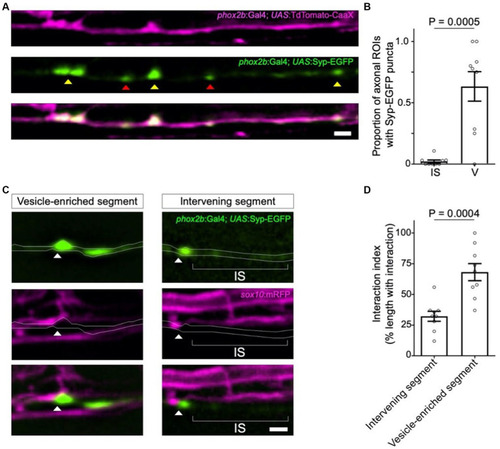
Syp-EGFP+ synaptic vesicles localize at sites of oligodendrocyte process interaction. (A) Representative confocal images of TdTomato-CaaX-labeled reticulospinal axons and EGFP-labeled synaptic vesicles in 4 dpf zebrafish spinal cord. Note Syp-EGFP puncta at both axon varicosities (yellow arrowheads) and intervening segments (red arrowheads). (B) Graph displays the proportion of axonal regions of interest (ROIs) that contained Syp-EGFP puncta. Each point represents the proportion of ROIs containing EGFP puncta per individual reticulospinal axon analyzed. Sample size = (number of ROIs, number of axons, number of animals) 339, 9, 8; bars show mean ± SEM, paired t-test. (C) Syp-EGFP and mRFP-labeled oligodendrocyte membranes observed in the larval zebrafish spinal cord (4 dpf). Arrowheads point to Syp-EGFP puncta associated with mRFP-labeled oligodendrocyte process extensions. (D) Graph displays the percent coverage of vesicle-enriched axon segments and intervening axon segments by oligodendrocyte process extensions. Sample size = (number of axons, number of animals) 9, 9; bars show mean ± SEM, unpaired t-test. For (A) and (C), images are lateral view with anterior left and dorsal up; scale bars = 2 μm.

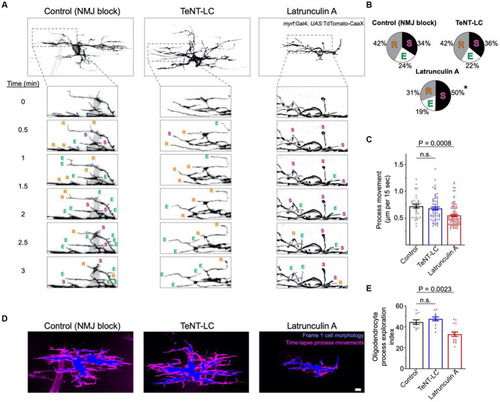
Synaptic vesicle release does not regulate overall exploratory behavior of all oligodendrocyte process extensions. (A) Representative confocal time-lapse images of TdTomato-CaaX labeled single oligodendrocytes (anterior left, dorsal side up). Within time-lapse series insets, E, R and S denote process extensions, retractions and stalls, respectively. (B) Pie charts display the proportion of processes that extended, retracted, or stalled during time-lapse imaging. Statistical testing (ordinary one-way ANOVA, Dunnett’s post-test) indicated increased stall behavior in the Latrunculin A (125 nM) group (p < 0.0001 for LatA vs. control) but no change caused by TeNT-LC (p = 0.87 for TeNT-LC vs. control). (C) Graph depicts the frame-to-frame rate of process movements, with individual points representing the average distance that individual processes moved during each 15 s time-lapse interval (per cell). Sample size (tracked processes, cells, animals) = 39, 8, 8 (control), 60, 8, 7 (TeNT-LC), 106, 19, 19 (Latrunculin A). (D) Composite images represent the extent of process movements during a 15 min time-lapse imaging window. Blue shaded areas represent the morphology of individual oligodendrocytes at the time of the first time-lapse frame. Magenta shaded areas represent all pixels surrounding the original position where processes moved into or occupied for one or more frames during the time-lapse. This magenta shaded region is a maximum intensity over time projection, thereby representing the history of process movements surrounding the blue first frame position. Scale bar = 5 μm. (E) Summary of the percentage of the area (μm2) surrounding the blue first frame position that was occupied by processes during the time-lapse (magenta). Percentage of area measurements were restricted to a 1.5 μm band surrounding the blue first frame position. Each data point represents the average percentage of area within the 1.5 μm band occupied by processes of individual oligodendrocytes (per cell). Sample size (individual cells, animals) = 10, 10 (control), 12, 11 (TeNT-LC), 15, 15 (Latrunculin A). For (C) and (E), bars represent mean ± SEM; Ordinary one-way ANOVA, Dunnett’s post test.

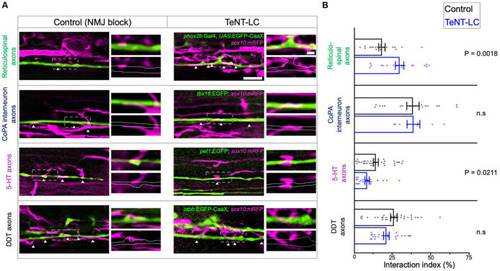
Synaptic vesicle release regulates oligodendrocyte-axon interactions in a neuron subtype specific manner. (A) Lateral view confocal images of GFP labeled axon interacting with oligodendrocyte processes labeled with RFP (anterior left, dorsal side up). White arrowheads point to sites of GFP-RFP colocalization. Scale bar = 5 μm, 1 μm (inset). (B) Graphs show the interaction index, which is defined as the percentage length of axon segments covered by interacting processes. Individual points represent the percent coverage of an individual axon. Sample size = number of animals, number of axons. Reticulospinal = 20, 20 (control), 19, 20 (TeNT-LC); CoPA = 18, 18 (control), 6, 8 (TeNT-LC); 5-HT = 19, 35 (control), 11, 24 (TeNT-LC); DDT = 23, 32 (control), 13, 24 (TeNT-LC). Black bars (controls) and blue bars (TeNT-LC) represent mean ± SEM. The p-values were derived using either a parametric t-test (Reticulospinals, CoPA) or Mann–Whitney test (5-HT, DDT) based on whether data showed a normal distribution.

Acknowledgments
This image is the copyrighted work of the attributed author or publisher, and ZFIN has permission only to display this image to its users. Additional permissions should be obtained from the applicable author or publisher of the image. Full text @ Front. Cell. Neurosci.