IMAGE

Figure 2

ID
ZDB-IMAGE-240606-48
Source
Figures for Gronseth et al., 2024
Image
Figure Caption

Figure 2

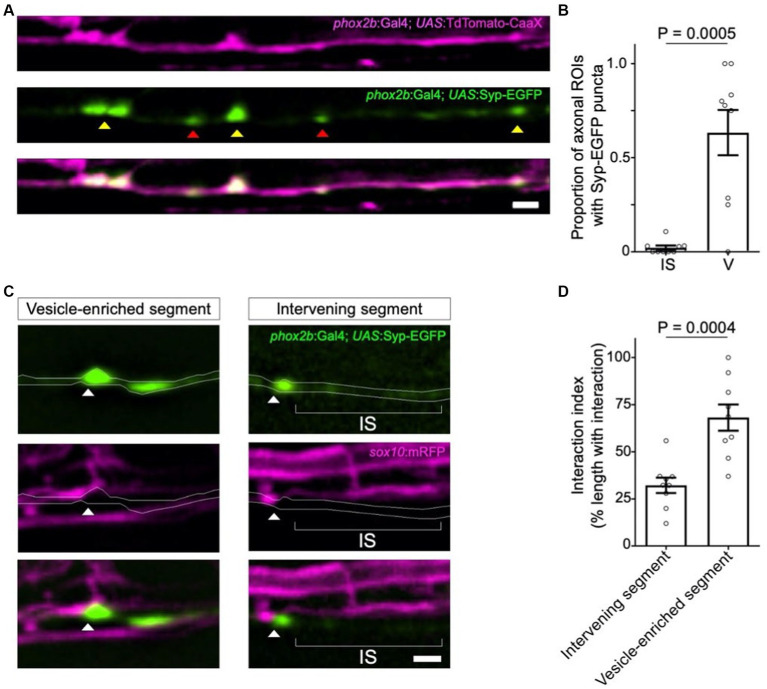
Syp-EGFP+ synaptic vesicles localize at sites of oligodendrocyte process interaction. (A) Representative confocal images of TdTomato-CaaX-labeled reticulospinal axons and EGFP-labeled synaptic vesicles in 4 dpf zebrafish spinal cord. Note Syp-EGFP puncta at both axon varicosities (yellow arrowheads) and intervening segments (red arrowheads). (B) Graph displays the proportion of axonal regions of interest (ROIs) that contained Syp-EGFP puncta. Each point represents the proportion of ROIs containing EGFP puncta per individual reticulospinal axon analyzed. Sample size = (number of ROIs, number of axons, number of animals) 339, 9, 8; bars show mean ± SEM, paired t-test. (C) Syp-EGFP and mRFP-labeled oligodendrocyte membranes observed in the larval zebrafish spinal cord (4 dpf). Arrowheads point to Syp-EGFP puncta associated with mRFP-labeled oligodendrocyte process extensions. (D) Graph displays the percent coverage of vesicle-enriched axon segments and intervening axon segments by oligodendrocyte process extensions. Sample size = (number of axons, number of animals) 9, 9; bars show mean ± SEM, unpaired t-test. For (A) and (C), images are lateral view with anterior left and dorsal up; scale bars = 2 μm.

Acknowledgments
This image is the copyrighted work of the attributed author or publisher, and ZFIN has permission only to display this image to its users. Additional permissions should be obtained from the applicable author or publisher of the image. Full text @ Front. Cell. Neurosci.