IMAGE

Figure 4

ID
ZDB-IMAGE-240606-50
Source
Figures for Gronseth et al., 2024
Image
Figure Caption

Figure 4

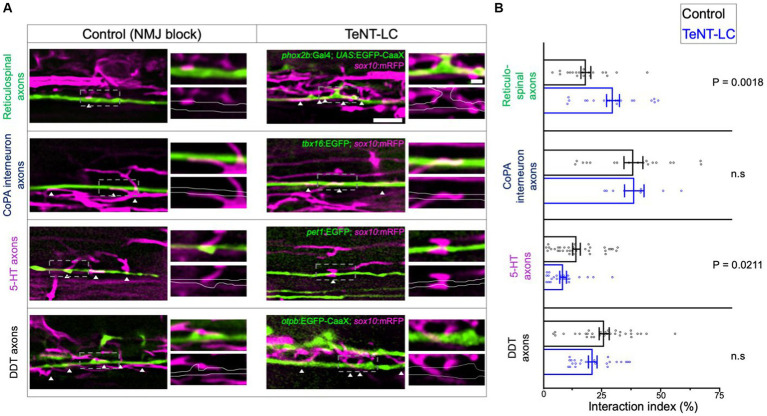
Synaptic vesicle release regulates oligodendrocyte-axon interactions in a neuron subtype specific manner. (A) Lateral view confocal images of GFP labeled axon interacting with oligodendrocyte processes labeled with RFP (anterior left, dorsal side up). White arrowheads point to sites of GFP-RFP colocalization. Scale bar = 5 μm, 1 μm (inset). (B) Graphs show the interaction index, which is defined as the percentage length of axon segments covered by interacting processes. Individual points represent the percent coverage of an individual axon. Sample size = number of animals, number of axons. Reticulospinal = 20, 20 (control), 19, 20 (TeNT-LC); CoPA = 18, 18 (control), 6, 8 (TeNT-LC); 5-HT = 19, 35 (control), 11, 24 (TeNT-LC); DDT = 23, 32 (control), 13, 24 (TeNT-LC). Black bars (controls) and blue bars (TeNT-LC) represent mean ± SEM. The p-values were derived using either a parametric t-test (Reticulospinals, CoPA) or Mann–Whitney test (5-HT, DDT) based on whether data showed a normal distribution.

Acknowledgments
This image is the copyrighted work of the attributed author or publisher, and ZFIN has permission only to display this image to its users. Additional permissions should be obtained from the applicable author or publisher of the image. Full text @ Front. Cell. Neurosci.