IMAGE

Figure 1

ID
ZDB-IMAGE-240606-47
Source
Figures for Gronseth et al., 2024
Image
Figure Caption

Figure 1

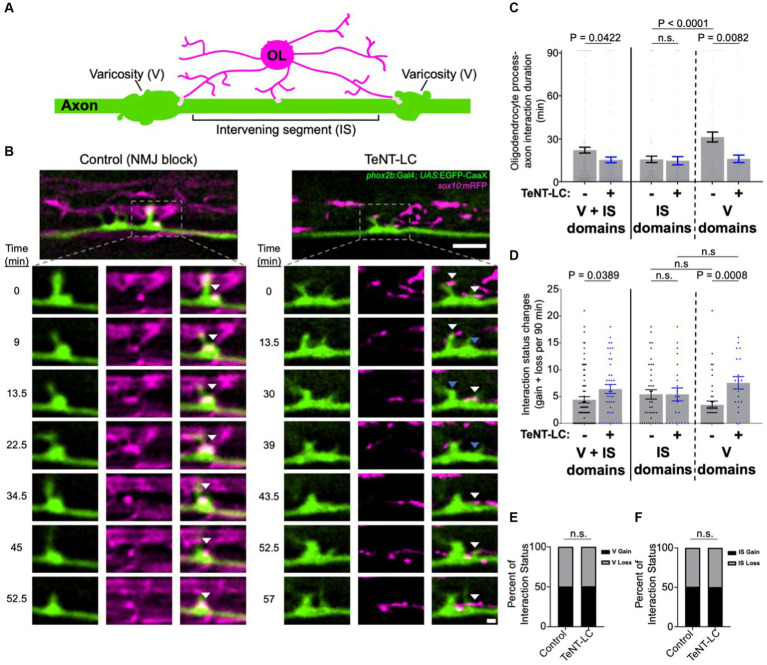
Synaptic vesicle release stabilizes oligodendrocyte interactions at axon varicosities. (A) Diagram illustrates an individual reticulospinal axon (green) and oligodendrocyte (OL) process extensions (magenta). Light pink shapes on the axon represent oligodendrocyte interactions. Axonal domains are segmented into varicosities (V) and intervening segments (IS). (B) Representative time-lapse images show oligodendrocyte-axon interactions over time in control (left) and TeNT-LC-expressing larval zebrafish (3 dpf). Lower inset images are individual timepoints derived from 90 min time-lapse imaging sessions. Transgenic reporter expression of membrane-tethered fluorescent proteins label oligodendrocyte (magenta) and individual reticulospinal axon (green) membranes. White arrows indicate EGFP-mRFP colocalization (interaction sites) and blue arrows denote the location of previous colocalization (retracted interactions). Images are spinal cord lateral views with anterior left and dorsal up; scale bars are 5 μm (upper) and 1 μm (insets). (C) Scatter plot points represent oligodendrocyte-axon interactions and their duration in minutes. Note that for 1 frame durations (1.5 min), for display purposes, an equal number of scatter points are shown above or below the 1.5 min position so all scatter points can be observed. Control IS vs. TeNT IS p = 0.2527. (D) Graph represents the total number of times oligodendrocyte-axon interactions were gained or lost at an individual reticulospinal axon segment across the entire 90 min time-lapse. Control IS vs. TeNT IS p = 0.9994, control V vs. control IS p = 0.1401, TeNT V vs. TeNT IS p = 0.2115. (E) Bar graph shows the percentage of oligodendrocyte process extension interactions at axon varicosities that were gained or lost during the 90 min time-lapse. p > 0.9999. (F) Bar graph shows the percentage of oligodendrocyte process extension interactions at axon intervening segments that were gained or lost during the 90 min time-lapse. p > 0.9999. For panels (C,D), bars represent mean ± SEM; sample size = 80 control and 41 TeNT-LC axon segments analyzed from 28 control and 14 TeNT-LC larvae. Reported p-values were obtained using the Mann–Whitney test (C,D) unpaired t-test (D), or Fisher’s exact test (E,F).

Acknowledgments
This image is the copyrighted work of the attributed author or publisher, and ZFIN has permission only to display this image to its users. Additional permissions should be obtained from the applicable author or publisher of the image. Full text @ Front. Cell. Neurosci.