
- Title
-
NudC regulated Lis1 stability is essential for the maintenance of dynamic microtubule ends in axon terminals
- Authors
- Kawano, D., Pinter, K., Chlebowski, M., Petralia, R.S., Wang, Y.X., Nechiporuk, A.V., Drerup, C.M.
- Source
- Full text @ iScience
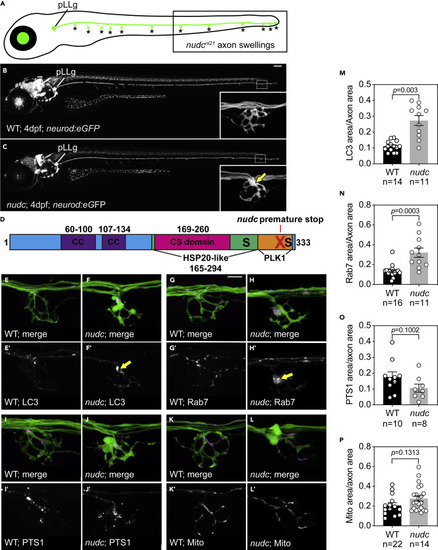
NudC loss of function causes axon terminal swellings in the long axons of the zebrafish posterior lateral line (pLL) (A) Schematic of a larval zebrafish at 4 dpf. The pLL ganglion (pLLg) is indicated. Asterisks point to axon terminals in the pLL system. The posterior half of the trunk is where pLL axon terminal swellings are clearly observed in nudc mutants (boxed). (B and C) Wild type and nudc TgBAC(neurod:egfp)nl1 larva at 4 dpf. Insets show a magnified view of a distal axon terminal. Arrow points to axon terminal swelling in nudc mutants. (D) Diagram of NudC domains, including Plk1 phosphorylation sites at S274 and S326 (S) and the premature stop site in the nudcnl21 line (red X). Also shown are the coiled coil (CC), HSP20-like, and CS domains. (E–L) Localization of autophagosomes (E, F), late endosomes (G, H), peroxisomes (I, J), and mitochondria (K, L) in wild type and nudc axon terminals. Arrows in (F’) and (H’) indicate the accumulation of LC3+ and Rab7+ vesicles in nudc mutant axon terminals. (M−P) Average organelle load (organelle area/axon area) in axon terminals (Wilcoxon rank sum). Data are expressed as mean ± S.E.M. Sample sizes indicated. Scale bar = 100 μm in B and C; 10 μm in E–L. |
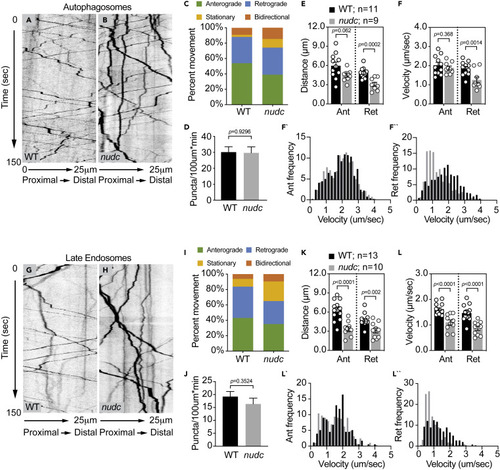
Decreased retrograde transport velocity of autophagosomes and late endosomes in nudc mutants (A and B) Kymograph analysis of LC3-labeled autophagosome transport. (C) The autophagosome transport frequency in nudc mutants. Anterograde transport frequency decreases but the percent of autophagosomes moving in the retrograde direction is not changed (ANOVA; anterograde: p = 0.0045; retrograde: p = 0.7890). Stationary particle frequency increases (ANOVA; p = 0.0023). (D) Total number of autophagosomes in the axon is unchanged (ANOVA). (E and F) Quantification of autophagosome transport distance and velocity show defects for both during retrograde transport (ANOVA). (F` and F``) Histograms of binned transport velocities show a clear shift to slower velocities for retrograde transport in nudc mutants. (G and H) Kymograph analysis of Rab7-labeled late endosome transport. (I) The percent of retrograde late endosome transport decreases in nudc mutants (ANOVA; p = 0.0346), while stationary particle frequency increases (ANOVA; p = 0.0031). (J) Total number of late endosomes in the axon is unchanged (ANOVA; p = 0.3524). (K and L) Quantification of late endosome transport distance and velocity show defects in both the anterograde and retrograde directions (ANOVA). (L` and L``) Binned histograms of transport velocities show a clear shift in retrograde transport toward slower speeds. Data are expressed as mean ± S.E.M. Sample sizes indicated on the graph. |
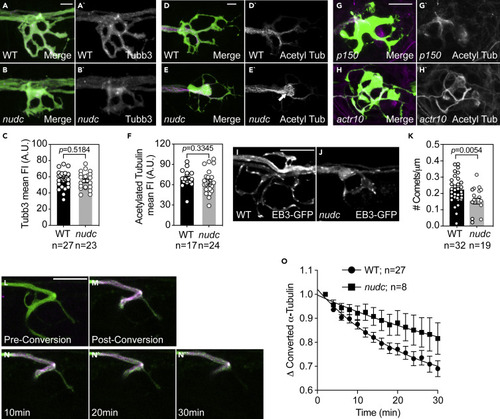
Microtubules in nudc axon terminals show signs of enhanced stabilization (A and B) Staining of Tubb3 in wild type and nudc terminals. (C) Quantification of Tubb3 fluorescence intensity shows no difference in nudc terminals (ANOVA). (D and E) Labeling of acetylated tubulin in wild type and nudc terminals. White arrow in (E’) highlights the net-like organization of acetylated tubulin staining in mutants (inset). (F) Quantification of acetylated tubulin fluorescence intensity shows no difference in nudc terminals though the organization is altered (ANOVA). (G and H) Acetylated tubulin labeling in axon terminals of two unrelated mutants, p150 and actr10, show no change in microtubule structure despite changes in the axon terminal structure. (I and J) Wild type (I) and nudc mutant (J) axon terminal showing EB3-GFP comets. (K) Axon terminal comet number is reduced in nudc mutants (ANOVA). (L–N) Dendra2-labeled α-tubulin in an axon terminal of the pLL. Prior to conversion, (L) no red fluorescence is detected (shown in magenta). Post-conversion, strong labeling of converted Dendra2-α-tubulin is observed (M). Converted Dendra2-α-tubulin decay over 30 min post-conversion shown in N. (O) Decay curve of converted Dendra2-α-tubulin from time-lapse imaging post-conversion demonstrates a shift in the half-life in nudc mutants (mixed effects model; p = 0.0033). Data are expressed as mean ± S.E.M. Scale bar = 10 μm. Sample sizes indicated on graphs. |
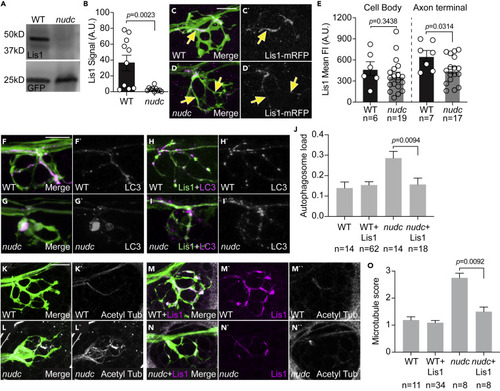
Lis1 functions downstream of NudC in the regulation of cargo transport and microtubule stability (A) Lis1 western demonstrates loss of Lis1 protein in nudc mutants at 4 dpf. GFP from TgBAC(neurod:egfp)nl1 transgene serves as an internal control. (B) Quantification of signal intensity relative to blot background confirms loss of Lis1 in nudc mutants (n = 10 independent blots; ANOVA). (C and D) Expression of Lis1-mRFP in individual neurons (magenta in merge, white on right). Arrows point to axons expressing Lis1. (E) Quantification of Lis1 means fluorescence intensity in the cell body and axon terminal of nudc mutants and wild-type siblings demonstrates a strong loss of Lis1 in mutant axon terminals (ANOVA). (F–I) Expression of Lis1-eGFP can suppress autophagosome accumulation in nudc mutants. (F and G) Expression of mRFP-LC3 (magenta in merge, white on right) in single axons of a wild type (F) and nudc mutant (G) shows accumulation in nudc mutants. Both carry the TgBAC(neurod:egfp)nl1 transgene to label neurons with cytosolic GFP. (H and I) Co-expression of Lis1-eGFP and mRFP-LC3 (magenta in merge, white on right) in nudc mutant axons can suppress autophagosome accumulation. (J) Quantification of autophagosome load (autophagosome area/axon area) demonstrates suppression of accumulation by expression of Lis1-eGFP in nudc mutants (ANOVA Tukey HSD post-hoc contrasts). (K–N) Expression of Lis1-mRFP can suppress the netting of acetylated microtubules in nudc mutants. (K and L) Wild type and nudc mutant controls stained for acetylated tubulin. (M and N) Wild type and nudc mutants expressing RFP-tagged Lis1 in axon terminals stained for acetylated tubulin. All carry the TgBAC(neurod:egfp)nl1 transgene to label neurons with cytosolic GFP. (O) Quantification of microtubule score (scale: 1 - wild-type microtubules; 2 – mild microtubule looping; 3 – presence of microtubule nets; Wilcoxon each pair). Data are expressed as mean ± S.E.M. Scale bar = 10 μm. Sample sizes indicated on graphs. |
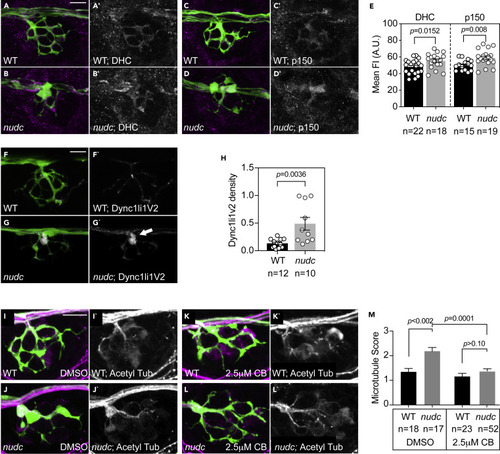
Pharmacological inhibition of dynein suppresses microtubule stabilization in nudc mutant axon terminals (A–D) Dynein heavy chain (DHC) and p150 (dynactin) accumulate in nudc mutant axon terminals. (E) Quantification of mean fluorescence intensity (normalized to background) for DHC and p150 (ANOVA). (F and G) mRFP-Dync1li1V2 expression in individual axons of wild type and nudc mutants demonstrates accumulation in mutant axon terminals (arrow). (H) Quantification of mRFP-Dync1li1V2 density (Dync1li1V2 area/axon terminal area) demonstrates the accumulation of this dynein light intermediate chain in nudc mutant axon terminals (ANOVA). (I–L) Wild type (I) and nudc mutant (J) axon terminals after 24 h 0.1% DMSO treatment. nudc mutants show large axon branchpoint swellings and acetylated tubulin netting in those swellings. (K and L) Treatment with 2.5 mM ciliobrevin (CB) suppresses axonal swellings and microtubule netting in nudc mutants. (M) Average qualitative score from two independent, blinded analyses (scale: 1 - wild-type microtubules; 2 – mild microtubule looping; 3 – presence of microtubule nets; Wilcoxon each pair). Data are expressed as mean ± S.E.M. Scale bar = 10 μm. Sample sizes indicated on graphs. |