
Fig. 4
- ID
- ZDB-FIG-240620-94
- Publication
- Kawano et al., 2022 - NudC regulated Lis1 stability is essential for the maintenance of dynamic microtubule ends in axon terminals
- Other Figures
- All Figure Page
- Back to All Figure Page
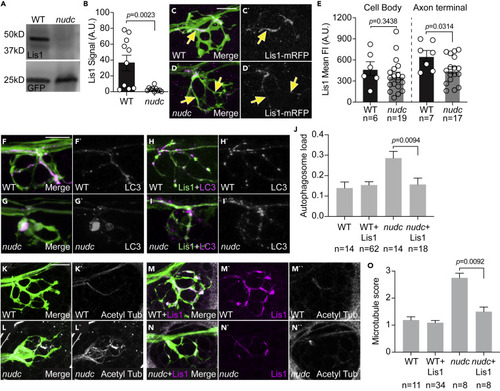
Lis1 functions downstream of NudC in the regulation of cargo transport and microtubule stability (A) Lis1 western demonstrates loss of Lis1 protein in nudc mutants at 4 dpf. GFP from TgBAC(neurod:egfp)nl1 transgene serves as an internal control. (B) Quantification of signal intensity relative to blot background confirms loss of Lis1 in nudc mutants (n = 10 independent blots; ANOVA). (C and D) Expression of Lis1-mRFP in individual neurons (magenta in merge, white on right). Arrows point to axons expressing Lis1. (E) Quantification of Lis1 means fluorescence intensity in the cell body and axon terminal of nudc mutants and wild-type siblings demonstrates a strong loss of Lis1 in mutant axon terminals (ANOVA). (F–I) Expression of Lis1-eGFP can suppress autophagosome accumulation in nudc mutants. (F and G) Expression of mRFP-LC3 (magenta in merge, white on right) in single axons of a wild type (F) and nudc mutant (G) shows accumulation in nudc mutants. Both carry the TgBAC(neurod:egfp)nl1 transgene to label neurons with cytosolic GFP. (H and I) Co-expression of Lis1-eGFP and mRFP-LC3 (magenta in merge, white on right) in nudc mutant axons can suppress autophagosome accumulation. (J) Quantification of autophagosome load (autophagosome area/axon area) demonstrates suppression of accumulation by expression of Lis1-eGFP in nudc mutants (ANOVA Tukey HSD post-hoc contrasts). (K–N) Expression of Lis1-mRFP can suppress the netting of acetylated microtubules in nudc mutants. (K and L) Wild type and nudc mutant controls stained for acetylated tubulin. (M and N) Wild type and nudc mutants expressing RFP-tagged Lis1 in axon terminals stained for acetylated tubulin. All carry the TgBAC(neurod:egfp)nl1 transgene to label neurons with cytosolic GFP. (O) Quantification of microtubule score (scale: 1 - wild-type microtubules; 2 – mild microtubule looping; 3 – presence of microtubule nets; Wilcoxon each pair). Data are expressed as mean ± S.E.M. Scale bar = 10 μm. Sample sizes indicated on graphs. |