
- Title
-
Manganese Overexposure Alters Neurogranin Expression and Causes Behavioral Deficits in Larval Zebrafish
- Authors
- Alba-González, A., Dragomir, E.I., Haghdousti, G., Yáñez, J., Dadswell, C., González-Méndez, R., Wilson, S.W., Tuschl, K., Folgueira, M.
- Source
- Full text @ Int. J. Mol. Sci.
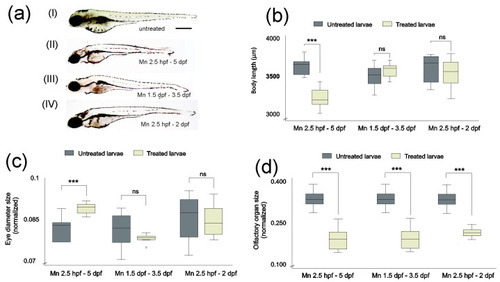
MnCl2 exposure causes morphological changes in zebrafish larvae at 5 dpf ( |
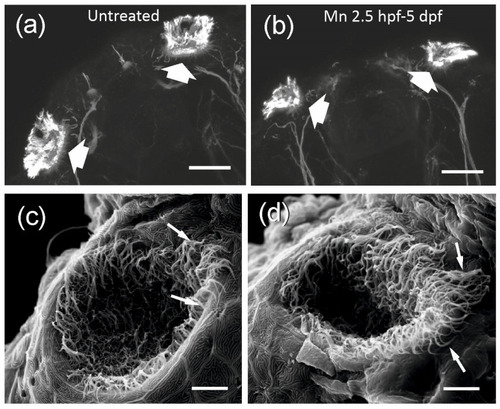
MnCl2 alters the morphology of the olfactory organ of larval zebrafish at 5 dpf. ( |
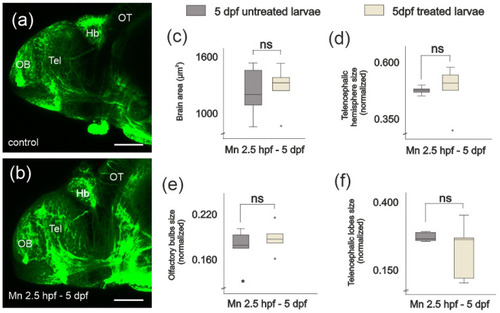
MnCl2 exposure does not lead to changes in the area of the lateral profile of the whole brain or the telencephalic regions at 5 dpf. ( |
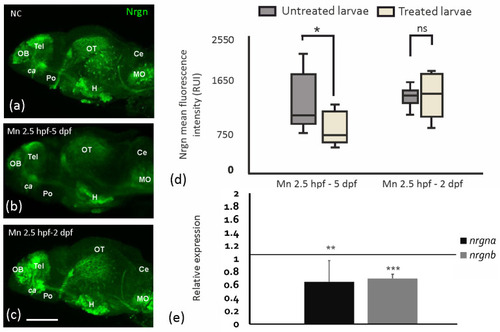
MnCl2 exposure reduces Nrgn expression in the brain. ( |
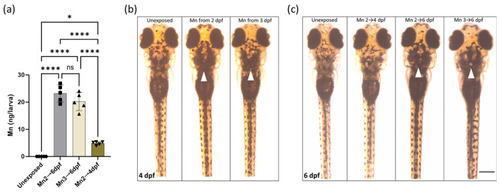
MnCl2 exposure causes dose-dependent Mn accumulation in whole larval zebrafish, accompanied by pigmentation changes. ( |
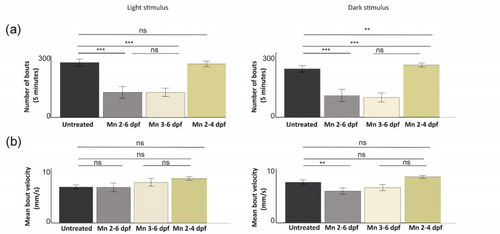
MnCl2 exposure effects on zebrafish larval behavior during light and dark conditions, as demonstrated by ( |
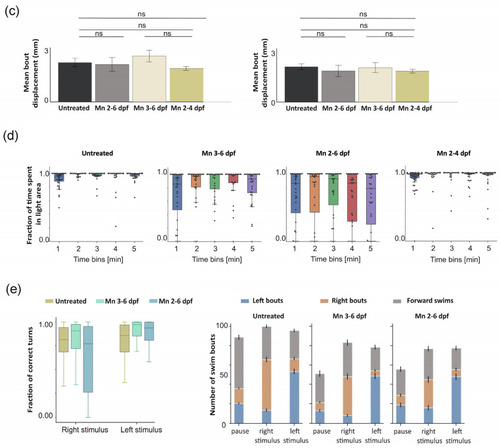
MnCl2 exposure effects on zebrafish larval behavior during light and dark conditions, as demonstrated by ( |