IMAGE

Figure 4

ID
ZDB-IMAGE-240513-106
Source
Figures for Alba-González et al., 2024
Image
Figure Caption

Figure 4

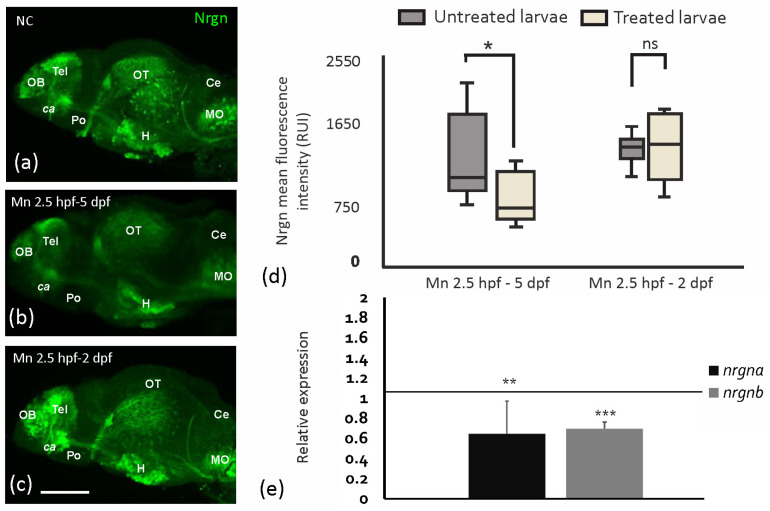
MnCl2 exposure reduces Nrgn expression in the brain. (ac) Representative images of Nrgn immunostaining of brains at 5 dpf (lateral views). (a) Negative control (NC)—unexposed larva. (b) Larva exposed to MnCl2 (500 µM) from 2.5 hpf to 5 dpf. (c) Larva exposed to MnCl2 (500 µM) from 2.5 hpf to 2 dpf. ca. anterior commissure. Ce, cerebellum; H, hypothalamus; NC, negative control; MO, medulla oblongata; OB, olfactory bulbs; OT, optic tectum; Po, preoptic area; Tel, telencephalon. Scale bar: 100 µm. (d) Neurogranin mean fluorescence intensity levels (Relative Unit Intensity (RUI)) at 5 dpf following MnCl2 exposure (500 µM). One-way ANOVA. * p = 0.048; ns, not significant. n = 8 larvae per condition. Data presented as mean ± SD. (e) mRNA expression of nrgna and nrgnb at 4 dpf upon MnCl2 exposure (500 µM) from 2.5 hpf. Student’s two-tailed t-test. nrgna: ** p = 0.026; nrgnb: *** p = 5.51 × 10⁻⁵. n = 6 per condition. Data presented as mean ± SD.

Acknowledgments
This image is the copyrighted work of the attributed author or publisher, and ZFIN has permission only to display this image to its users. Additional permissions should be obtained from the applicable author or publisher of the image. Full text @ Int. J. Mol. Sci.