
- Title
-
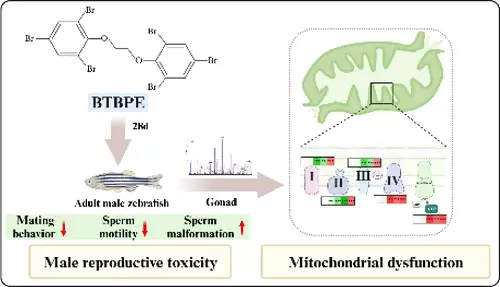
Mechanistic Insights into 1,2-bis(2,4,6-tribromophenoxy)ethane-Induced Male Reproductive Toxicity in Zebrafish
- Authors
- Zheng, N., Wang, X., Zhang, Y., Hua, J., Zhu, B., Zhou, Y., Xu, Z., Luo, L., Han, J., Yang, L., Zhou, B.
- Source
- Full text @ Env. Sci. Tech.
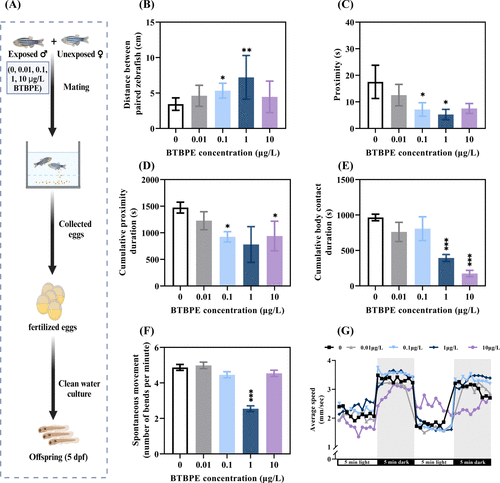
Behavioral underperformance of male adults and their offspring upon BTBPE exposure. (A) Schematic diagram of exposure of male zebrafish and offspring culture. (B) Average distance between the paired zebrafish. (C) Average time in the proximity of the paired zebrafish. (D) The cumulative body proximity duration. (E) The cumulative body contact duration. (F) Spontaneous movements of offspring during 22 to 25 hpf. (G) The light–dark stimulated activity of offspring at 120 hpf. Data represented as the mean ± SEM from three replicates. *p < 0.05, **p < 0.01, and ***p < 0.001 denote statistically significant differences between BTBPE treatment and the control. |
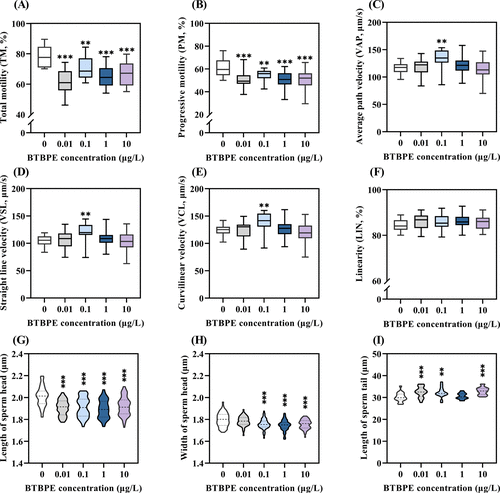
Effects of BTBPE exposure on sperm parameters. (A) Total motility. (B) Progressive motility. (C) Average path velocity. (D) Straight line velocity. (E) Curvilinear velocity. (F) Linearity (Ratio of VSL/VCL). (G) The average length of the sperm head. (H) The average width of sperm head. (I) The average length of sperm tail. About 100 spermatozoa (n = 100) were randomly selected and monitored for sperm morphology in each group (schematic diagram of sperm morphology measurement in the Figure S4). Data are represented as the mean ± SEM *p < 0.05, **p < 0.01, and ***p < 0.001 denote statistically significant differences between BTBPE treatment and the control. |
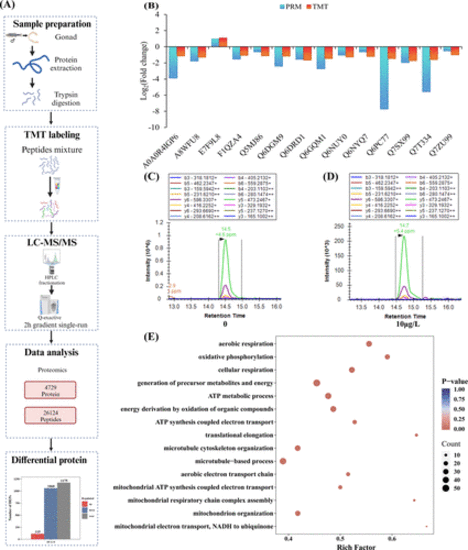
Proteomic analysis in male zebrafish testes after exposure to 10 μg/L of BTBPE. (A) Schematic diagram of TMT-labeling proteome analysis. (B) The Log2 (fold change) of PRM results for TMT-based proteomic. (C, D) extracted-ion chromatograms for the representative peptide from Q7SX99 (fumarate hydratase protein) under 0 and 10 μg/L BTBPE treatments. (E) Significantly enriched GO pathways in biological process of DEPs of whole proteome. |
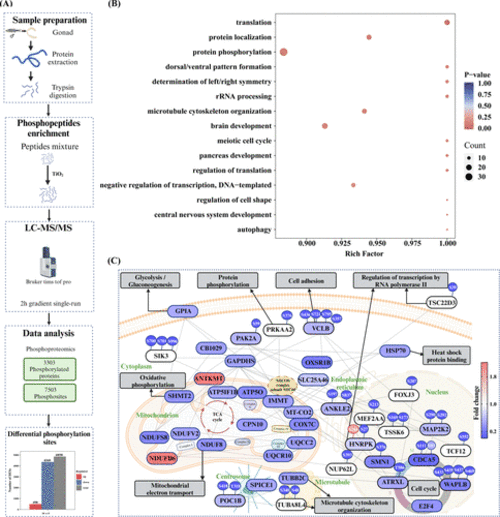
Phosphoproteome analysis in male zebrafish testes after exposure to 10 μg/L of BTBPE. (A) Schematic diagram of phosphoproteome analysis. (B) Significantly enriched GO pathways in biological process of proteins harboring differentially phosphorylated sites of phosphoproteome. (C) Protein interactive networks after exposure to 10 μg/L BTBPE. Red and blue colors indicate upregulation and downregulation in proteome and phosphoproteome, respectively. |
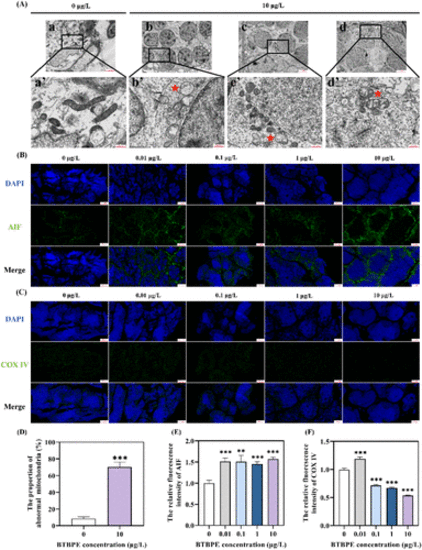
Potential effects on mitochondria in zebrafish testes upon BTBPE exposure. (A) Mitochondrial ultrastructure (a’: 0 μg/L, while b’–d’: 10 μg/L. a’–d’ are magnified views of a–d, respectively. Scale bar = 500 nm). Mitochondrial immunofluorescence of (B) apoptosis-inducing factor 1 (AIF) and (C) cytochrome c oxidase subunit 4 isoform 1 (COX IV). Scale bar = 50 μm. (D) The proportion of abnormal mitochondria increases upon BTBPE treatments. The relative fluorescence intensity of (E) AIF and (F) COX IV. Data represented as the mean ± SEM (n = 3 individuals). **p < 0.01 and ***p < 0.001 denote statistically significant differences between BTBPE treatment and the control. |
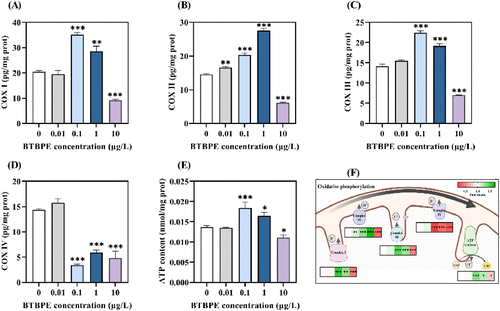
Effects of mitochondrial functions in zebrafish testes after BTBPE exposure. The activity of (A) COX I. (B) COX II. (C) COX III. (D) COX IV. (E) The contents of ATP. (F) The overall changing profiles of mitochondrial functions. Data represented as the mean ± SEM from three replicates. *p < 0.05, **p < 0.01, and ***p < 0.001 denote statistically significant differences between BTBPE treatment and the control. |
|