
Image
|
Figure Caption
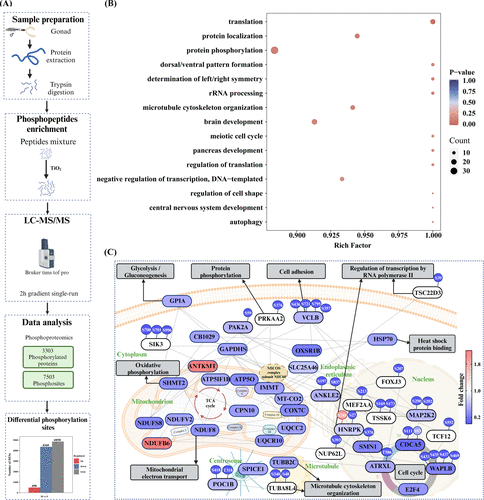
Fig. 4 Phosphoproteome analysis in male zebrafish testes after exposure to 10 μg/L of BTBPE. (A) Schematic diagram of phosphoproteome analysis. (B) Significantly enriched GO pathways in biological process of proteins harboring differentially phosphorylated sites of phosphoproteome. (C) Protein interactive networks after exposure to 10 μg/L BTBPE. Red and blue colors indicate upregulation and downregulation in proteome and phosphoproteome, respectively.
Acknowledgments
This image is the copyrighted work of the attributed author or publisher, and
ZFIN has permission only to display this image to its users.
Additional permissions should be obtained from the applicable author or publisher of the image.
Full text @ Env. Sci. Tech.