FIGURE SUMMARY
Title

Mucopolysaccharidosis type II zebrafish model exhibits early impaired proteasomal-mediated degradation of the axon guidance receptor Dcc

Authors
Manzoli, R., Badenetti, L., Bruzzone, M., Macario, M.C., Rubin, M., Dal Maschio, M., Roveri, A., Moro, E.
Source
Full text @ Cell Death Dis.

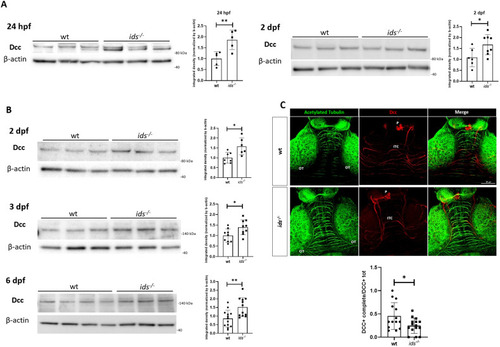
Dcc is significantly upregulated in ids mutant since embryonic stages.

A Representative western blot for Dcc at 24 hpf (left) and 2 dpf (right). In both cases, lysates from whole dissected heads showed Dcc upregulation in ids mutant fish-derived samples with respect to wild-type ones (n = at least 5 biological replicates, pools of 20 dissected heads). B Western blot analysis of Dcc protein levels on extracted brains at 2, 3 and 6 dpf. Consistently, Dcc upregulation is significantly observed in ids mutant conditions when compared to controls (n = at least 6 biological replicates, pools of 20 dissected brains). From 3 dpf, Dcc showed a strong immunoreactive band at 140 kDa. C Whole-mount immunofluorescence on 6 dpf dissected brains. Acetylated tubulin was used to mark axonal processes in the midbrain region. The bar graph below shows the ratio between the number of axons displaying Dcc immunoreactivity in the entire length (Dcc+ complete) and the total Dcc-positive commissures (Dcc+ tot) for each genotype (n = 14 biological replicates). Dorsal view, anterior to the top. ITC intertectal commissures, OT optic tectum, P pineal gland. Scale bar: 50 μm. Data are expressed as the mean ± SD (*p < 0.05; **p < 0.005; t-test).

ids mutant fish-derived primary neurons show short axons and impaired lysosomal acidification.

A Lysotracker staining (red) on wild-type and ids mutant fish-derived primary cell cultures at 2 DIV. Concanavalin (green) and Hoechst staining (blue) are reported to visualize cell membranes and nuclei, respectively. Magnifications of the Lysotracker-stained cells with reduced signal in mutant fish-derived cells are shown. On the right, bar graphs represent the area and integrated density quantifications normalized to cell number. In both cases, a significant decrease is measured in mutant fish-derived primary neurons when compared to controls (n = 4 independent experiments). B On the left, a scheme of the exploited microfluidic device is depicted. It is constituted by four wells and two main compartments divided by a microgroove barrier. Cells are seeded in one chamber and axons extend towards the other one. On the right, representative confocal images of wild-type and ids mutant fish-derived primary neurons seeded in the microfluidic device (2 DIV). Cultures were stained with concanavalin to easily trace processes. Below, magnifications of crossing axons are shown. The graph on the right resumes the results obtained by measuring crossing axons lengths (n = 3 independent experiments). ids mutant fish-derived neurons presented consistently shorter axons when compared to controls at 2 DIV. Scale bar: 50 μm. Data are expressed as the mean ± SD (*p < 0.05; t-test).

ids mutant fish-derived primary neurons exhibit Dcc upregulation with enrichment of Dcc-positive puncta.

A Significant Dcc upregulation in ids mutant fish-derived primary neurons was detectable since 6 HIV (at least n = 4 biological replicates) and maintained at 2 DIV (n = 7 biological replicates), as depicted by western blots and related bar graphs. IDS recombinant enzyme (Elaprase) treatment of ids mutant-derived cells restores Dcc levels to those of wild-type cells (n = 7 biological replicates). B Representative Dcc immunofluorescence on wild-type and ids mutant fish-derived primary cells at 2 DIV. Acetylated tubulin (green) was used to trace neuronal processes. The bar graph on the right displays the quantification of Dcc-positive aggregates per cell. The magnification highlights Dcc-positive spots (n = 4 independent experiments). Scale bar: 50 μm. Data are expressed as the mean ± SD (**p < 0.005; t-test).

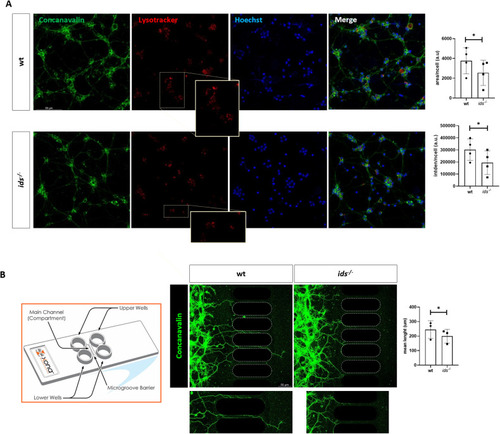
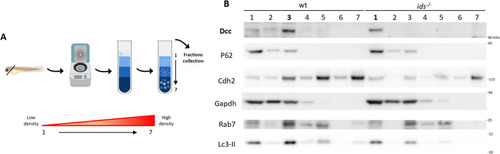
P62 protein levels are increased in Dcc-enriched fractions of ids mutant fish-derived protein lysates.

A Graphical representation of the workflow adopted for the fractional precipitation assay (created with Biorender). Briefly, 2 dpf dissected heads were homogenized and subjected to first centrifugation; then, the supernatant was loaded on top of a sucrose column to be submitted to ultracentrifugation. Finally, fractions were retrieved from the top (low density) to the bottom (high density) of the sucrose gradient. B Representative western blot depicting wild-type and ids mutant fish lysates subjected to fractional precipitations. Fractions are reported from 1 to 7, with bold numbers highlighting the fraction with higher Dcc enrichment (fraction 3 for control and fraction 1 for ids mutant-derived lysates). The distributions of P62, N-cadherin (Cdh2), Gapdh (glyceraldehyde-3-phosphate dehydrogenase), Rab7 (Ras-associated binding protein 7), and Lc3-II were analysed. While the majority of markers were distributed in the same way in the two genotypes, P62 was particularly enriched in the same fraction displaying high Dcc protein levels only in ids mutant conditions.

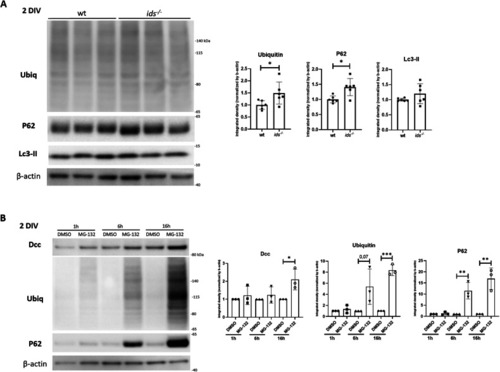
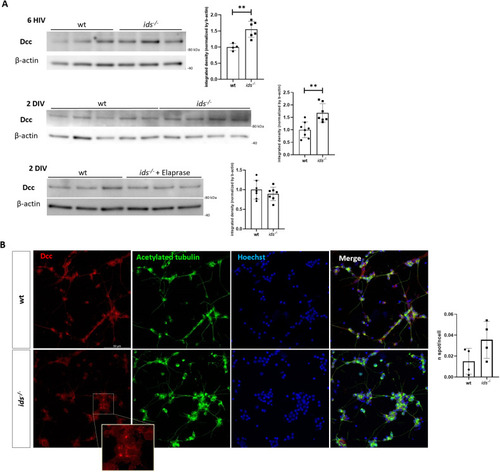
Proteasome inhibition in wild-type primary neurons results in Dcc upregulation.

A Western blot analysis on 2 DIV wild-type and ids mutant fish-derived primary neurons showed significant upregulation of polyubiquitinated proteins and P62, as depicted by the bar graphs on the right. On the other hand, no differences were found for Lc3-II (n = 6 biological replicates). B Wild-type fish-derived primary neurons were treated with MG-132 (proteasome inhibitor) for 1, 6, or 16 hours and then analysed at 2 DIV. On the left, representative western blots for Dcc, ubiquitin and P62. After 16 hours of treatment, Dcc levels were significantly increased when compared to DMSO (n = 3 independent experiments). Data are expressed as the mean ± SD (*p < 0.05; **p < 0.005; ***p < 0.001; t-test).

ids mutant larvae exhibit significantly altered anxiety-induced response.

A 15 dpf ids mutant and wild-type larvae were challenged with the LDT test to elicit an anxiety-like response. The bar graph on the left reports the mean distance run by each group of larvae every five minutes (representative trial). Black boxes are put in correspondence to the five minutes of complete darkness (D1: first dark phase, 20–25 min; D2: second dark phase, 35–40 min; D3: third dark phase, 50–55 min). Data are expressed as the mean ± SD (n = 6 biological replicates). B The bar graphs depict the evaluation of the “increments” for each dark phase. During D1 and D2 ids mutant larvae display a negative value of the increment, whereas controls increment their locomotion, as expected. In D3, no differences were observed between genotypes (n = 6 independent experiments). Data are expressed as the mean ± SD (*p < 0.05; t-test).

Acknowledgments
This image is the copyrighted work of the attributed author or publisher, and ZFIN has permission only to display this image to its users. Additional permissions should be obtained from the applicable author or publisher of the image. Full text @ Cell Death Dis.