IMAGE

Fig. 1

ID
ZDB-IMAGE-240418-31
Source
Figures for Manzoli et al., 2024
Image
Figure Caption

Fig. 1 
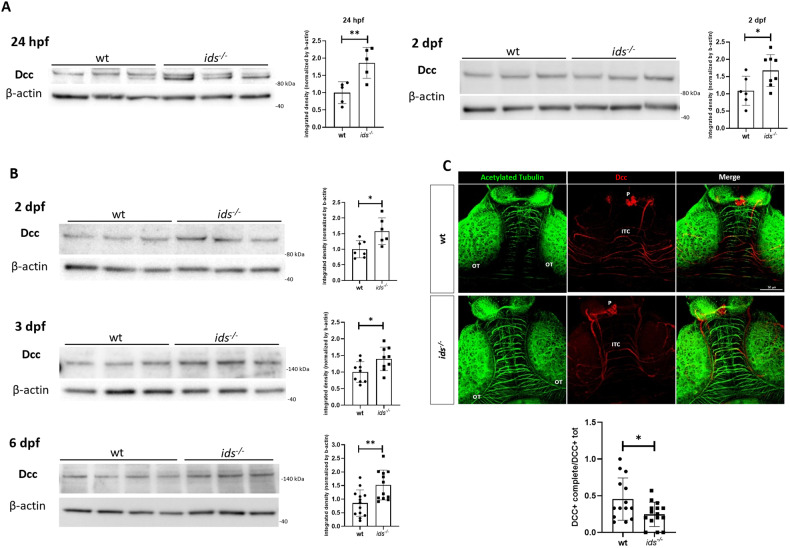
Dcc is significantly upregulated in ids mutant since embryonic stages.

A Representative western blot for Dcc at 24 hpf (left) and 2 dpf (right). In both cases, lysates from whole dissected heads showed Dcc upregulation in ids mutant fish-derived samples with respect to wild-type ones (n = at least 5 biological replicates, pools of 20 dissected heads). B Western blot analysis of Dcc protein levels on extracted brains at 2, 3 and 6 dpf. Consistently, Dcc upregulation is significantly observed in ids mutant conditions when compared to controls (n = at least 6 biological replicates, pools of 20 dissected brains). From 3 dpf, Dcc showed a strong immunoreactive band at 140 kDa. C Whole-mount immunofluorescence on 6 dpf dissected brains. Acetylated tubulin was used to mark axonal processes in the midbrain region. The bar graph below shows the ratio between the number of axons displaying Dcc immunoreactivity in the entire length (Dcc+ complete) and the total Dcc-positive commissures (Dcc+ tot) for each genotype (n = 14 biological replicates). Dorsal view, anterior to the top. ITC intertectal commissures, OT optic tectum, P pineal gland. Scale bar: 50 μm. Data are expressed as the mean ± SD (*p < 0.05; **p < 0.005; t-test).

Acknowledgments
This image is the copyrighted work of the attributed author or publisher, and ZFIN has permission only to display this image to its users. Additional permissions should be obtained from the applicable author or publisher of the image. Full text @ Cell Death Dis.