
- Title
-
Mitochondrial abnormalities contribute to muscle weakness in a Dnajb6 deficient zebrafish model
- Authors
- McKaige, E.A., Lee, C., Calcinotto, V., Giri, S., Crawford, S., McGrath, M.J., Ramm, G., Bryson-Richardson, R.J.
- Source
- Full text @ Hum. Mol. Genet.
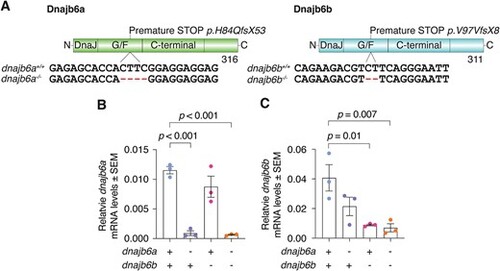
Generation of a dnajb6 loss of function mutant. (A) Zebrafish mutant lines for dnajb6a and dnajb6b. Both mutations result in premature STOP codons. (B) qRT-PCR analysis shows a significant loss of dnajb6a transcript in single and double mutants compared to their wildtype siblings. (C) Significant decrease in dnajb6b levels in single and double mutants relative to wildtype levels at 3 mpf. Both mutations appear to result in nonsense mediated decay. Analysis was completed in triplicate and error bars represent SEM. Values are relative to the mean of lsm12b and ef1α values. Genotypes were compared using a one-way ANOVA and two-way Dunnett multiple comparisons test. |
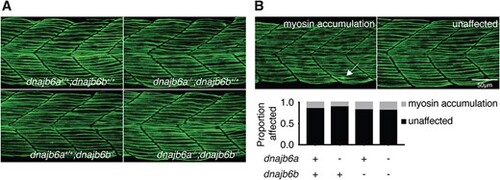
Double dnajb6 mutant zebrafish do not show signs of myopathy during early development. (A) Immunofluorescence staining of methyl cellulose treated dnajb6 mutants and their siblings with anti-myosin at 1 dpf. Larvae were incubated in methyl cellulose for 1 h prior to fixation. Maximum projection confocal images were taken laterally of the trunk above the egg yolk extension. (B) Images show examples of the phenotype scored. Quantification and analysis of the fibre damage phenotype showed no significant differences between genotypes (P > 0.05, binomial test). Analysis was completed with n ≥ 28 per genotype. |
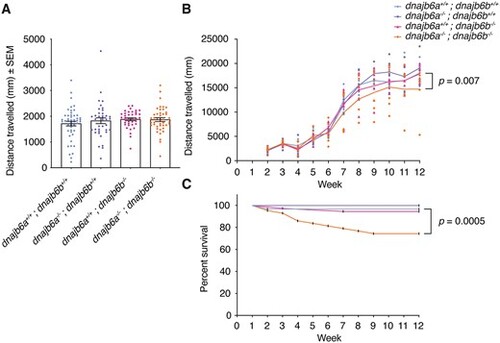
Functional analysis reveals late onset muscle weakness in double dnajb6 mutants. (A) The distance travelled was not significantly different between genotypes at 6 dpf. The swimming of dnajb6 fish was recorded for a period of 10 min and each dot represents an individual fish. Analysis was completed in triplicate with n ≥ 38 per genotype. Error bars show standard error of the mean (SEM). Genotypes were compared using a linear model. (B) Double mutant fish show a significant decline in motor function over time (P = 0.007). Fish were genotyped prior to the start of the experiment and their movement was recorded weekly from 2 weeks post fertilisation (wpf) to 12 wpf. Each dot represents the average swimming distance of one group, with six groups per genotype. Analysis was completed with n ≥ 34 per genotype from week 2 onwards and a mixed linear model. (C) Survival of double mutant fish was significantly less than wildtype fish (P = 0.0005). Analysis was completed with n ≥ 29 per genotype from week 1 onwards. Kaplan–Meier survival curves were compared using the mantel-cox log rank test. |
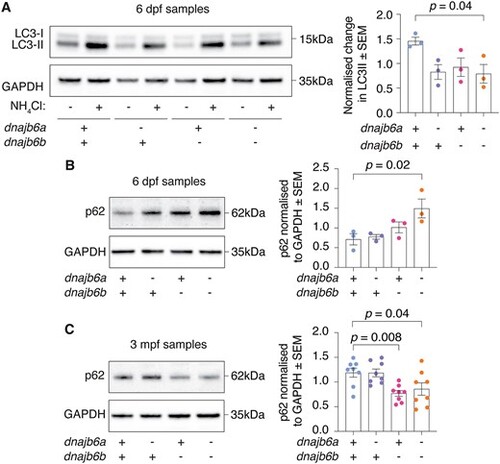
Analysis of autophagy markers reveals early defect in double mutants. (A) Double mutant fish show a significant reduction in autophagic flux activity at 6 dpf based on difference in LC3-II levels between NH4Cl treated and untreated zebrafish. Experiment was completed in triplicate. (B) Western blot at 6 dpf shows a significant accumulation of p62 in double mutants. Error bars represent SEM for three biological replicates. (C) At 3 mpf dnajb6b single mutants and double mutants show a significant reduction in p62 levels compared to wildtype. Error bars represent SEM for eight fish across 3 biological replicates. GAPDH was used as a loading control and P62 values are normalised to GAPDH. Datasets were analysed with a one-way ANOVA and a two-way Dunnett multiple comparisons test. |
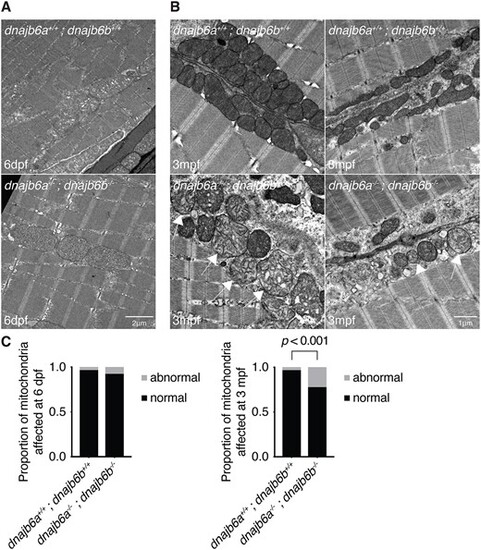
Double dnajb6 mutants show mitochondrial abnormalities. (A) Electron microscopy of double mutant and wildtype muscle at 6 dpf shows no visible difference between double dnajb6 mutants and wildtype. (B) Ultrastructure of 3 mpf double mutant and wildtype muscle reveals mitochondria with abnormal cristae arrangement (arrow). (C) Quantification of mitochondrial abnormalities at 6 dpf and 3 mpf. At 6 dpf there was no sign of mitochondrial abnormalities in double mutants. However, at 3 mpf there was a significant increase in the proportion of abnormal mitochondria in double mutants compared to wildtype (P < 0.001, based on a binomial test). Analysis at both timepoints was completed blinded with two biological replicates and n = 4 per genotype. |
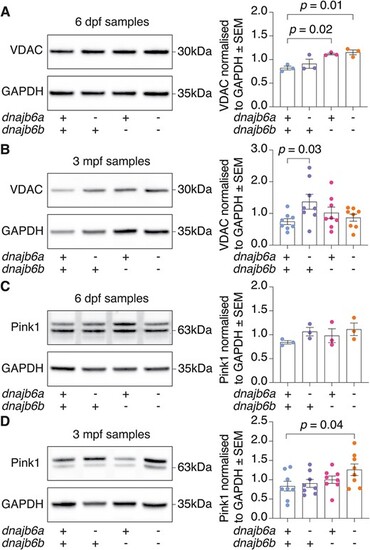
Western blot analysis shows dnajb6 double mutants have an increase in Pink1 levels indicating mitochondrial damage. (A) VDAC protein levels were increased at 6 dpf in dnajb6b mutants and double mutants. (B) At 3 mpf VDAC protein levels were significantly increased in dnajb6a single mutants but not in double mutants. (C) Western blot of Pink1 at 6 dpf shows no significant differences between genotypes. (D) Double mutants show significantly higher levels of Pink1 compared to their wildtype siblings at 3 mpf. Values are normalised to wildtype and GAPDH was used as a loading control. Error bars represent SEM for three biological replicates at 6 dpf and eight samples from 3 biological replicates at 3 mpf. Analysis was completed using a one-way ANOVA and two-way Dunnett multiple comparisons test. |
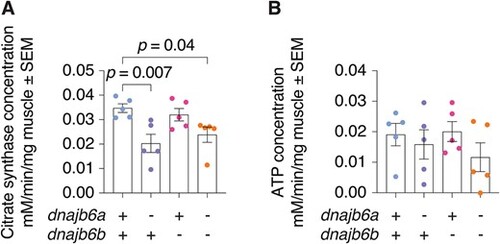
Mitochondrial cristae content is decreased in double dnajb6 mutants. (A) Activity levels of citrate synthase are decreased in dnajb6a and dnajb6a;dnajb6b mutants at 3 mpf compared to wildtype siblings. (B) Analysis of ATP levels suggests no significant differences between genotypes at 3 mpf. Graph shows values normalised to time and mg of muscle tissue. Error bars represent SEM for five samples. Analysis was completed using a one-way ANOVA and two-way Dunnett multiple comparisons test. |