
- Title
-
Prosaposin maintains adult neural stem cells in a state associated with deep quiescence
- Authors
- Labusch, M., Thetiot, M., Than-Trong, E., Morizet, D., Coolen, M., Varet, H., Legendre, R., Ortica, S., Mancini, L., Bally-Cuif, L.
- Source
- Full text @ Stem Cell Reports
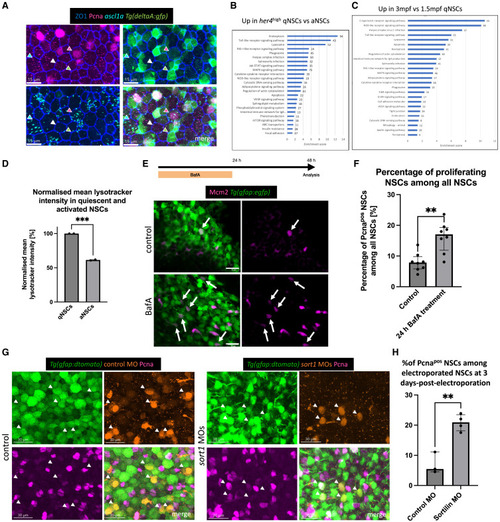
Lysosomes are involved in adult neural stem cell quiescence (A) Whole-mount immunostaining for ZO1 (tight junctions, blue), PCNA (proliferation, magenta), and GFP (transcriptional reporter for deltaA, green), with RNAScope against ascl1a transcripts (preactivation, cyan). Dorsal “apical” view of the pallial ventricular zone at 3 MPF. Green arrow: deltaApos quiescent progenitors, white arrow: deltaAneg qNSC, cyan: pre-activated progenitors, magenta: activated progenitors. Scale bar: 15 μm. (B) KEGG pathways enriched in qNSCs vs. aNSCs based on GO analysis of the RNA-seq data (RFPhigh, GFPneg vs. RFPpos, GFPpos cells from 3 MPF Tg(gfap:egfp); Tg(mcm5:nls-rfp) fish). x axis: enrichment score; numbers next to the bars: number of genes included in this pathway. (C) KEGG pathways enriched in qNSCs at 3.5 months vs. qNSCs at 1.5 months based on GO of the RNA-seq data. As in (B). (D) Normalized mean LysoTracker intensity (bar plot with SD; each dot is 1 independent experiment with 10 pooled brains). Unpaired t test, ∗∗∗p = 0.0003. (E) Experimental design and view of telencephalic organotypic slices after IHC for GFP (NSCs, green) and MCM2 (proliferation, magenta) after control and BafA treatment. Arrows: Mcm2pos,GFPpos NSCs. Scale bars: 10 μm. (F) Proportion of proliferating NSCs (Pcnapos) among all NSCs. Each dot represents 1 animal (with 1–4 treated slices per animal). Bar at median with IQR. Mann-Whitney test, ∗∗p = 0.0026. (G) Whole-mount IHC for Tg(gfap:dTomato) (NSCs, green), and PCNA (proliferation, magenta) in combination with control and sort1a/sort1b-MO-electroporated cells (orange). Dorsal view of the pallial ventricular zone at 3 MPF. Arrows point to electroporated NSCs. Scale bar: 30 μm. (H) Percentage of activated NSCs among all electroporated NSCs 3 days after control- and sort1-MO electroporation. Each dot is 1 fish. Line at median with IQR. Unpaired t test with Welch’s correction, ∗∗p = 0.0064. |
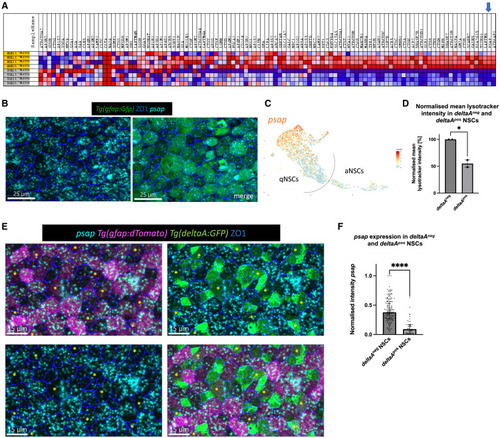
Psap is heterogeneously expressed in quiescent NSCs (A) Gene expression heatmap of the lysosome KEGG gene set (red = upregulated, blue = downregulated). Each line is 1 biological replicate (gray = aNSCs, yellow = deeply qNSCs – her4high), based on our bulk RNA-seq dataset. Arrow to psap. (B) Whole-mount RNAScope for psap (cyan) and IHC for Tg(gfap:eGFP) (NSCs, green) and ZO1 (tight junctions, blue). Dorsal view of the pallial ventricular zone at 3 MPF. Psap is heterogeneously expressed. Scale bar: 25 μm. (C) Uniform manifold approximation and projection of psap expression in NSCs (scRNA-seq dataset of Morizet et al., 2023). Psap is enriched in cells with deepest/longest quiescence (compare with Figure S4A). (D) Normalized mean LysoTracker intensity in deltaApos and deltaAneg NSCs; bar plot with SD. Each dot is 1 independent experiment with 10 pooled brains. Unpaired t test, ∗p = 0.0218. (E) Whole-mount RNAScope for psap (cyan) and triple IHC for Tg(gfap:dTomato) (magenta), Tg(deltaA:eGFP) (green), and ZO1 (tight junctions, blue). Dorsal view of the pallial ventricular zone at 3 MPF; merged channel, bottom right. Yellow asterisks indicate examples of deltaApos NSCs. Scale bars: 15 μm. (F) Normalized intensity sum of psap after two-dimensional projection in deltaAneg and deltaApos cells within the gfap:dTomatopos NSC population. The highest intensity value has been set to 1. Every dot represents 1 cell; 3 independent experiments. Mann-Whitney test, ∗∗∗∗p ≤ 0.0001. |
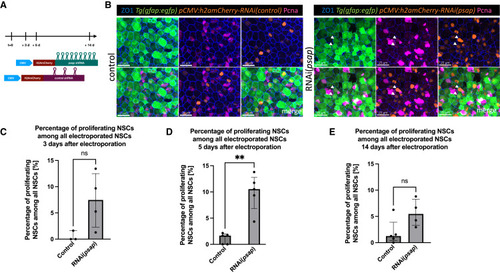
Psap activity promotes NSC quiescence (A) Experimental design: at day 0, pCMV:RNAi(psap) and pCMV:RNAi(control) were electroporated in pallial NSCs in 3 MPF fish. The fish were sacrificed at 3, 5, and 14 dpe. (B) Whole-mount IHC for ZO1 (tight junctions, blue), GFP (NSCs, green), H2amCherry (electroporated cells, orange), and PCNA (proliferation, magenta) at 5 dpe in RNAi control and RNAi(psap) electroporated fish. Dorsal view of the pallium. Scale bar: 25 μm. Arrows: proliferating NSCs. (C) Percentage of aNSCs among all electroporated NSCs at 3 dpe in control vs. psap-RNAi. Each dot is 1 fish. Line at median with IQR. Mann-Whitney test, ns, not significant, p = 0.1143. (D) Percentage of aNSCs among all electroporated NSCs at 5 dpe in control vs. psap-RNAi. Each dot is 1 fish. Line at median with IQR. Mann-Whitney test, ∗∗p = 0.0079. (E) Percentage of activated NSCs among all electroporated NSCs at 14 dpe in control vs. psap-RNAi. Each dot is 1 fish. Line at median with IQR. Mann-Whitney test, p = 0.0635. |
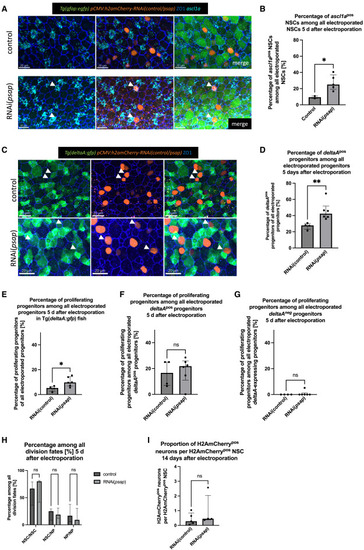
Psap knockdown increases the proportion of NSCs in states associated with shallow quiescence, without affecting neurogenesis output (A) RNAScope for ascl1a (turquoise) and whole-mount IHC for gfap:GFP (green), H2amCherry (electroporated cells, orange), and ZO1 (tight junctions, blue) 5 days after electroporation of control (top) and psap-RNAi (bottom) construct in Tg(gfap:egfp) fish. Dorsal view of the pallial ventricular zone at 3 MPF. Arrows: examples of ascl1apos cells. Scale bar: 20 μm. (B) Percentage of ascl1apos NSCs among all electroporated NSCs 5 days after control and psap-RNAi. Line at median with IQR. Unpaired t test with Welch’s correction, ∗p = 0.0112. (C) Whole-mount IHC for gfap:GFP (green), H2amCherry (electroporated cells, orange), and ZO1 (tight junctions, blue) 5 days after electroporation of RNAi control (top) and RNAi(psap) construct. Dorsal view of the pallium at 3 MPF. Arrows: GFPpos progenitor cells. Scale bar: 20 μm. (D) Percentage of deltaApos progenitor cells among all electroporated progenitor cells 5 days after control and psap-RNAi electroporation. Each dot is 1 fish. Line at median with IQR. Mann-Whitney test, ∗∗p = 0.0095. (E–G) Percentage of proliferating progenitors 5 days after control and psap-RNAi electroporation among all of the electroporated progenitors (E), among all of the electroporated deltaApos progenitors (F), and among all of the electroporated deltaAneg progenitors (G). Each dot represents 1 animal. Line at median with IQR. Mann-Whitney tests: (E) ∗p = 0.0381, (F) p = 0.9286, and (G) p > 0.9999. (H) Percentage of the different division modes in control vs. RNAi(psap) electroporated cells at 5 dpe (see Figure S4 for 3 and 14 dpe). x axis: state of the 2 sister cells in doublets. Lines at median with IQR. Mann-Whitney tests, NSC/NSC doublets: p = 0.8413; NSC/NP doublets: p = 0.7936; NP/NP doublets: p = 0.6429. (I) Ratio of neurons relative to NSCs in electroporated cells and their progeny. Each dot is 1 fish. Line at median with IQR. Mann-Whitney test, p = 0.4127. |