
|
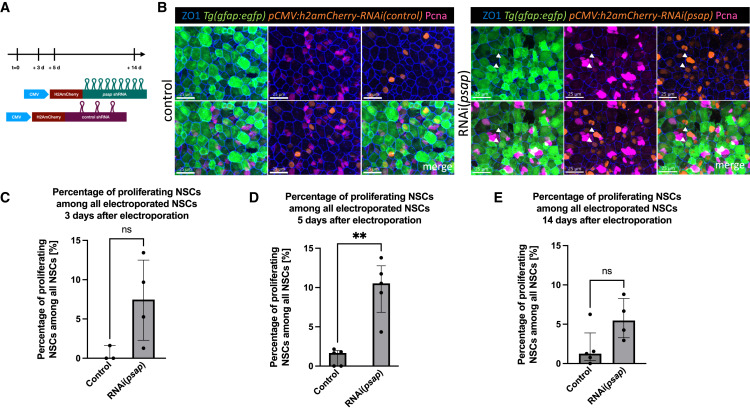
Fig. 3 Psap activity promotes NSC quiescence (A) Experimental design: at day 0, pCMV:RNAi(psap) and pCMV:RNAi(control) were electroporated in pallial NSCs in 3 MPF fish. The fish were sacrificed at 3, 5, and 14 dpe. (B) Whole-mount IHC for ZO1 (tight junctions, blue), GFP (NSCs, green), H2amCherry (electroporated cells, orange), and PCNA (proliferation, magenta) at 5 dpe in RNAi control and RNAi(psap) electroporated fish. Dorsal view of the pallium. Scale bar: 25 μm. Arrows: proliferating NSCs. (C) Percentage of aNSCs among all electroporated NSCs at 3 dpe in control vs. psap-RNAi. Each dot is 1 fish. Line at median with IQR. Mann-Whitney test, ns, not significant, p = 0.1143. (D) Percentage of aNSCs among all electroporated NSCs at 5 dpe in control vs. psap-RNAi. Each dot is 1 fish. Line at median with IQR. Mann-Whitney test, ∗∗p = 0.0079. (E) Percentage of activated NSCs among all electroporated NSCs at 14 dpe in control vs. psap-RNAi. Each dot is 1 fish. Line at median with IQR. Mann-Whitney test, p = 0.0635.