
|
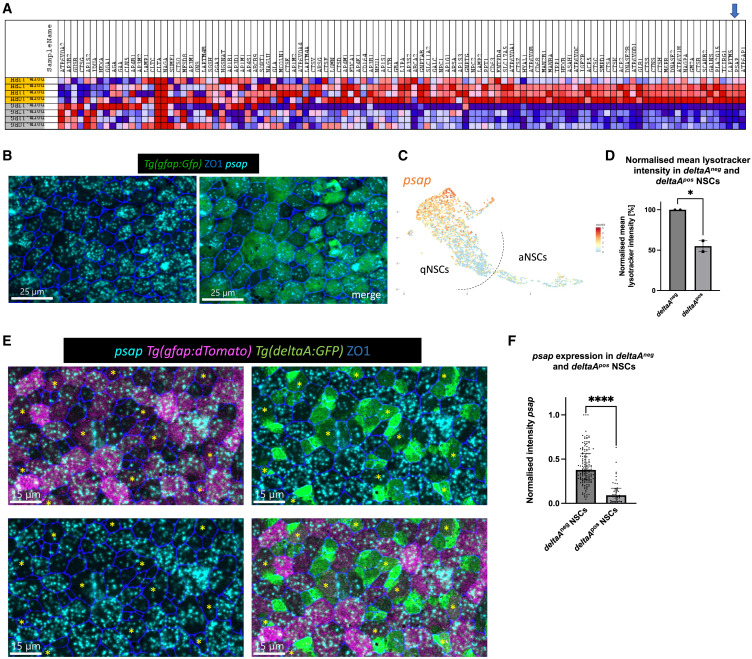
Fig. 2 Psap is heterogeneously expressed in quiescent NSCs (A) Gene expression heatmap of the lysosome KEGG gene set (red = upregulated, blue = downregulated). Each line is 1 biological replicate (gray = aNSCs, yellow = deeply qNSCs – her4high), based on our bulk RNA-seq dataset. Arrow to psap. (B) Whole-mount RNAScope for psap (cyan) and IHC for Tg(gfap:eGFP) (NSCs, green) and ZO1 (tight junctions, blue). Dorsal view of the pallial ventricular zone at 3 MPF. Psap is heterogeneously expressed. Scale bar: 25 μm. (C) Uniform manifold approximation and projection of psap expression in NSCs (scRNA-seq dataset of Morizet et al., 2023). Psap is enriched in cells with deepest/longest quiescence (compare with Figure S4A). (D) Normalized mean LysoTracker intensity in deltaApos and deltaAneg NSCs; bar plot with SD. Each dot is 1 independent experiment with 10 pooled brains. Unpaired t test, ∗p = 0.0218. (E) Whole-mount RNAScope for psap (cyan) and triple IHC for Tg(gfap:dTomato) (magenta), Tg(deltaA:eGFP) (green), and ZO1 (tight junctions, blue). Dorsal view of the pallial ventricular zone at 3 MPF; merged channel, bottom right. Yellow asterisks indicate examples of deltaApos NSCs. Scale bars: 15 μm. (F) Normalized intensity sum of psap after two-dimensional projection in deltaAneg and deltaApos cells within the gfap:dTomatopos NSC population. The highest intensity value has been set to 1. Every dot represents 1 cell; 3 independent experiments. Mann-Whitney test, ∗∗∗∗p ≤ 0.0001.