
Fig. 4
- ID
- ZDB-FIG-240517-117
- Publication
- Labusch et al., 2024 - Prosaposin maintains adult neural stem cells in a state associated with deep quiescence
- Other Figures
- All Figure Page
- Back to All Figure Page
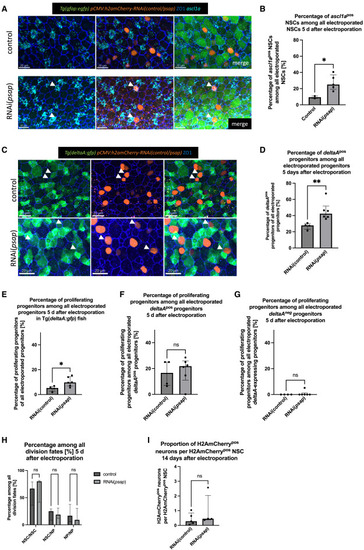
Psap knockdown increases the proportion of NSCs in states associated with shallow quiescence, without affecting neurogenesis output (A) RNAScope for ascl1a (turquoise) and whole-mount IHC for gfap:GFP (green), H2amCherry (electroporated cells, orange), and ZO1 (tight junctions, blue) 5 days after electroporation of control (top) and psap-RNAi (bottom) construct in Tg(gfap:egfp) fish. Dorsal view of the pallial ventricular zone at 3 MPF. Arrows: examples of ascl1apos cells. Scale bar: 20 μm. (B) Percentage of ascl1apos NSCs among all electroporated NSCs 5 days after control and psap-RNAi. Line at median with IQR. Unpaired t test with Welch’s correction, ∗p = 0.0112. (C) Whole-mount IHC for gfap:GFP (green), H2amCherry (electroporated cells, orange), and ZO1 (tight junctions, blue) 5 days after electroporation of RNAi control (top) and RNAi(psap) construct. Dorsal view of the pallium at 3 MPF. Arrows: GFPpos progenitor cells. Scale bar: 20 μm. (D) Percentage of deltaApos progenitor cells among all electroporated progenitor cells 5 days after control and psap-RNAi electroporation. Each dot is 1 fish. Line at median with IQR. Mann-Whitney test, ∗∗p = 0.0095. (E–G) Percentage of proliferating progenitors 5 days after control and psap-RNAi electroporation among all of the electroporated progenitors (E), among all of the electroporated deltaApos progenitors (F), and among all of the electroporated deltaAneg progenitors (G). Each dot represents 1 animal. Line at median with IQR. Mann-Whitney tests: (E) ∗p = 0.0381, (F) p = 0.9286, and (G) p > 0.9999. (H) Percentage of the different division modes in control vs. RNAi(psap) electroporated cells at 5 dpe (see Figure S4 for 3 and 14 dpe). x axis: state of the 2 sister cells in doublets. Lines at median with IQR. Mann-Whitney tests, NSC/NSC doublets: p = 0.8413; NSC/NP doublets: p = 0.7936; NP/NP doublets: p = 0.6429. (I) Ratio of neurons relative to NSCs in electroporated cells and their progeny. Each dot is 1 fish. Line at median with IQR. Mann-Whitney test, p = 0.4127. |