
- Title
-
Isolation and proteomic study of fish liver lipid droplets
- Authors
- Sun, Y., Heng, J., Liu, F., Zhang, S., Liu, P.
- Source
- Full text @ Biophys Rep
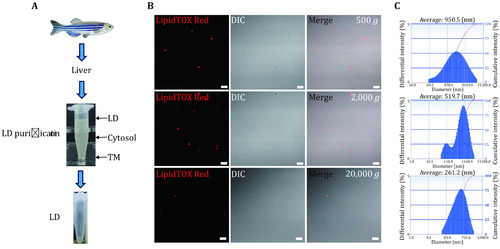
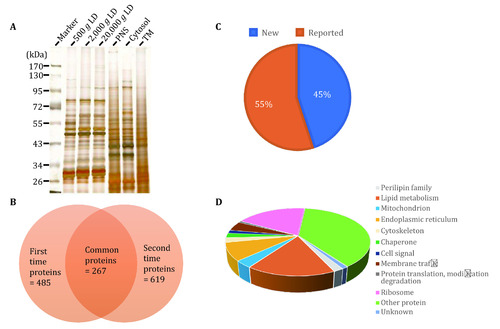
Isolation of LDs from zebrafish liver. |
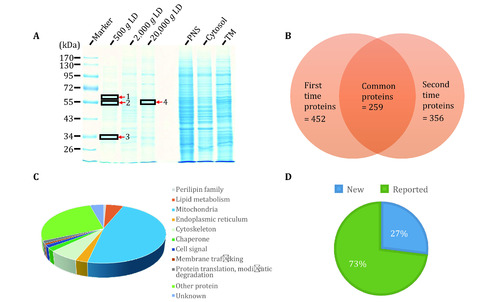
Proteomic analysis of isolated LDs from zebrafish liver. |
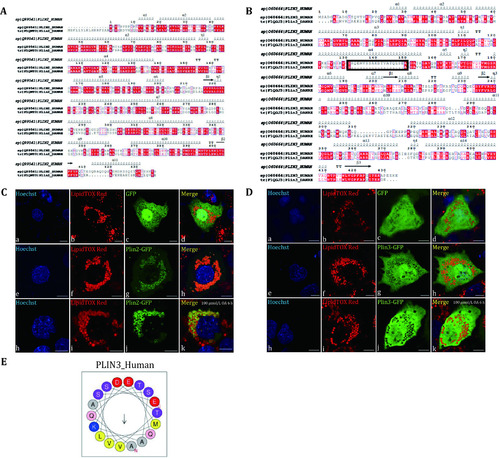
Localization of Plin2 and Plin3 of zebrafish in Huh7 cells. |
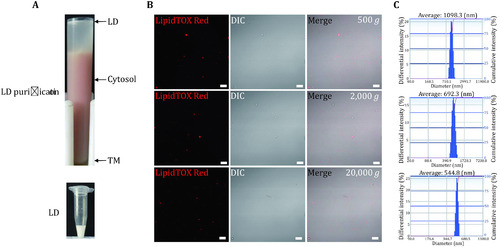
Isolation of LDs from |
Proteomic analyses of isolated LDs from |