IMAGE

Figure 2

ID
ZDB-IMAGE-231130-65
Source
Figures for Sun et al., 2023
Image
Figure Caption

Figure 2

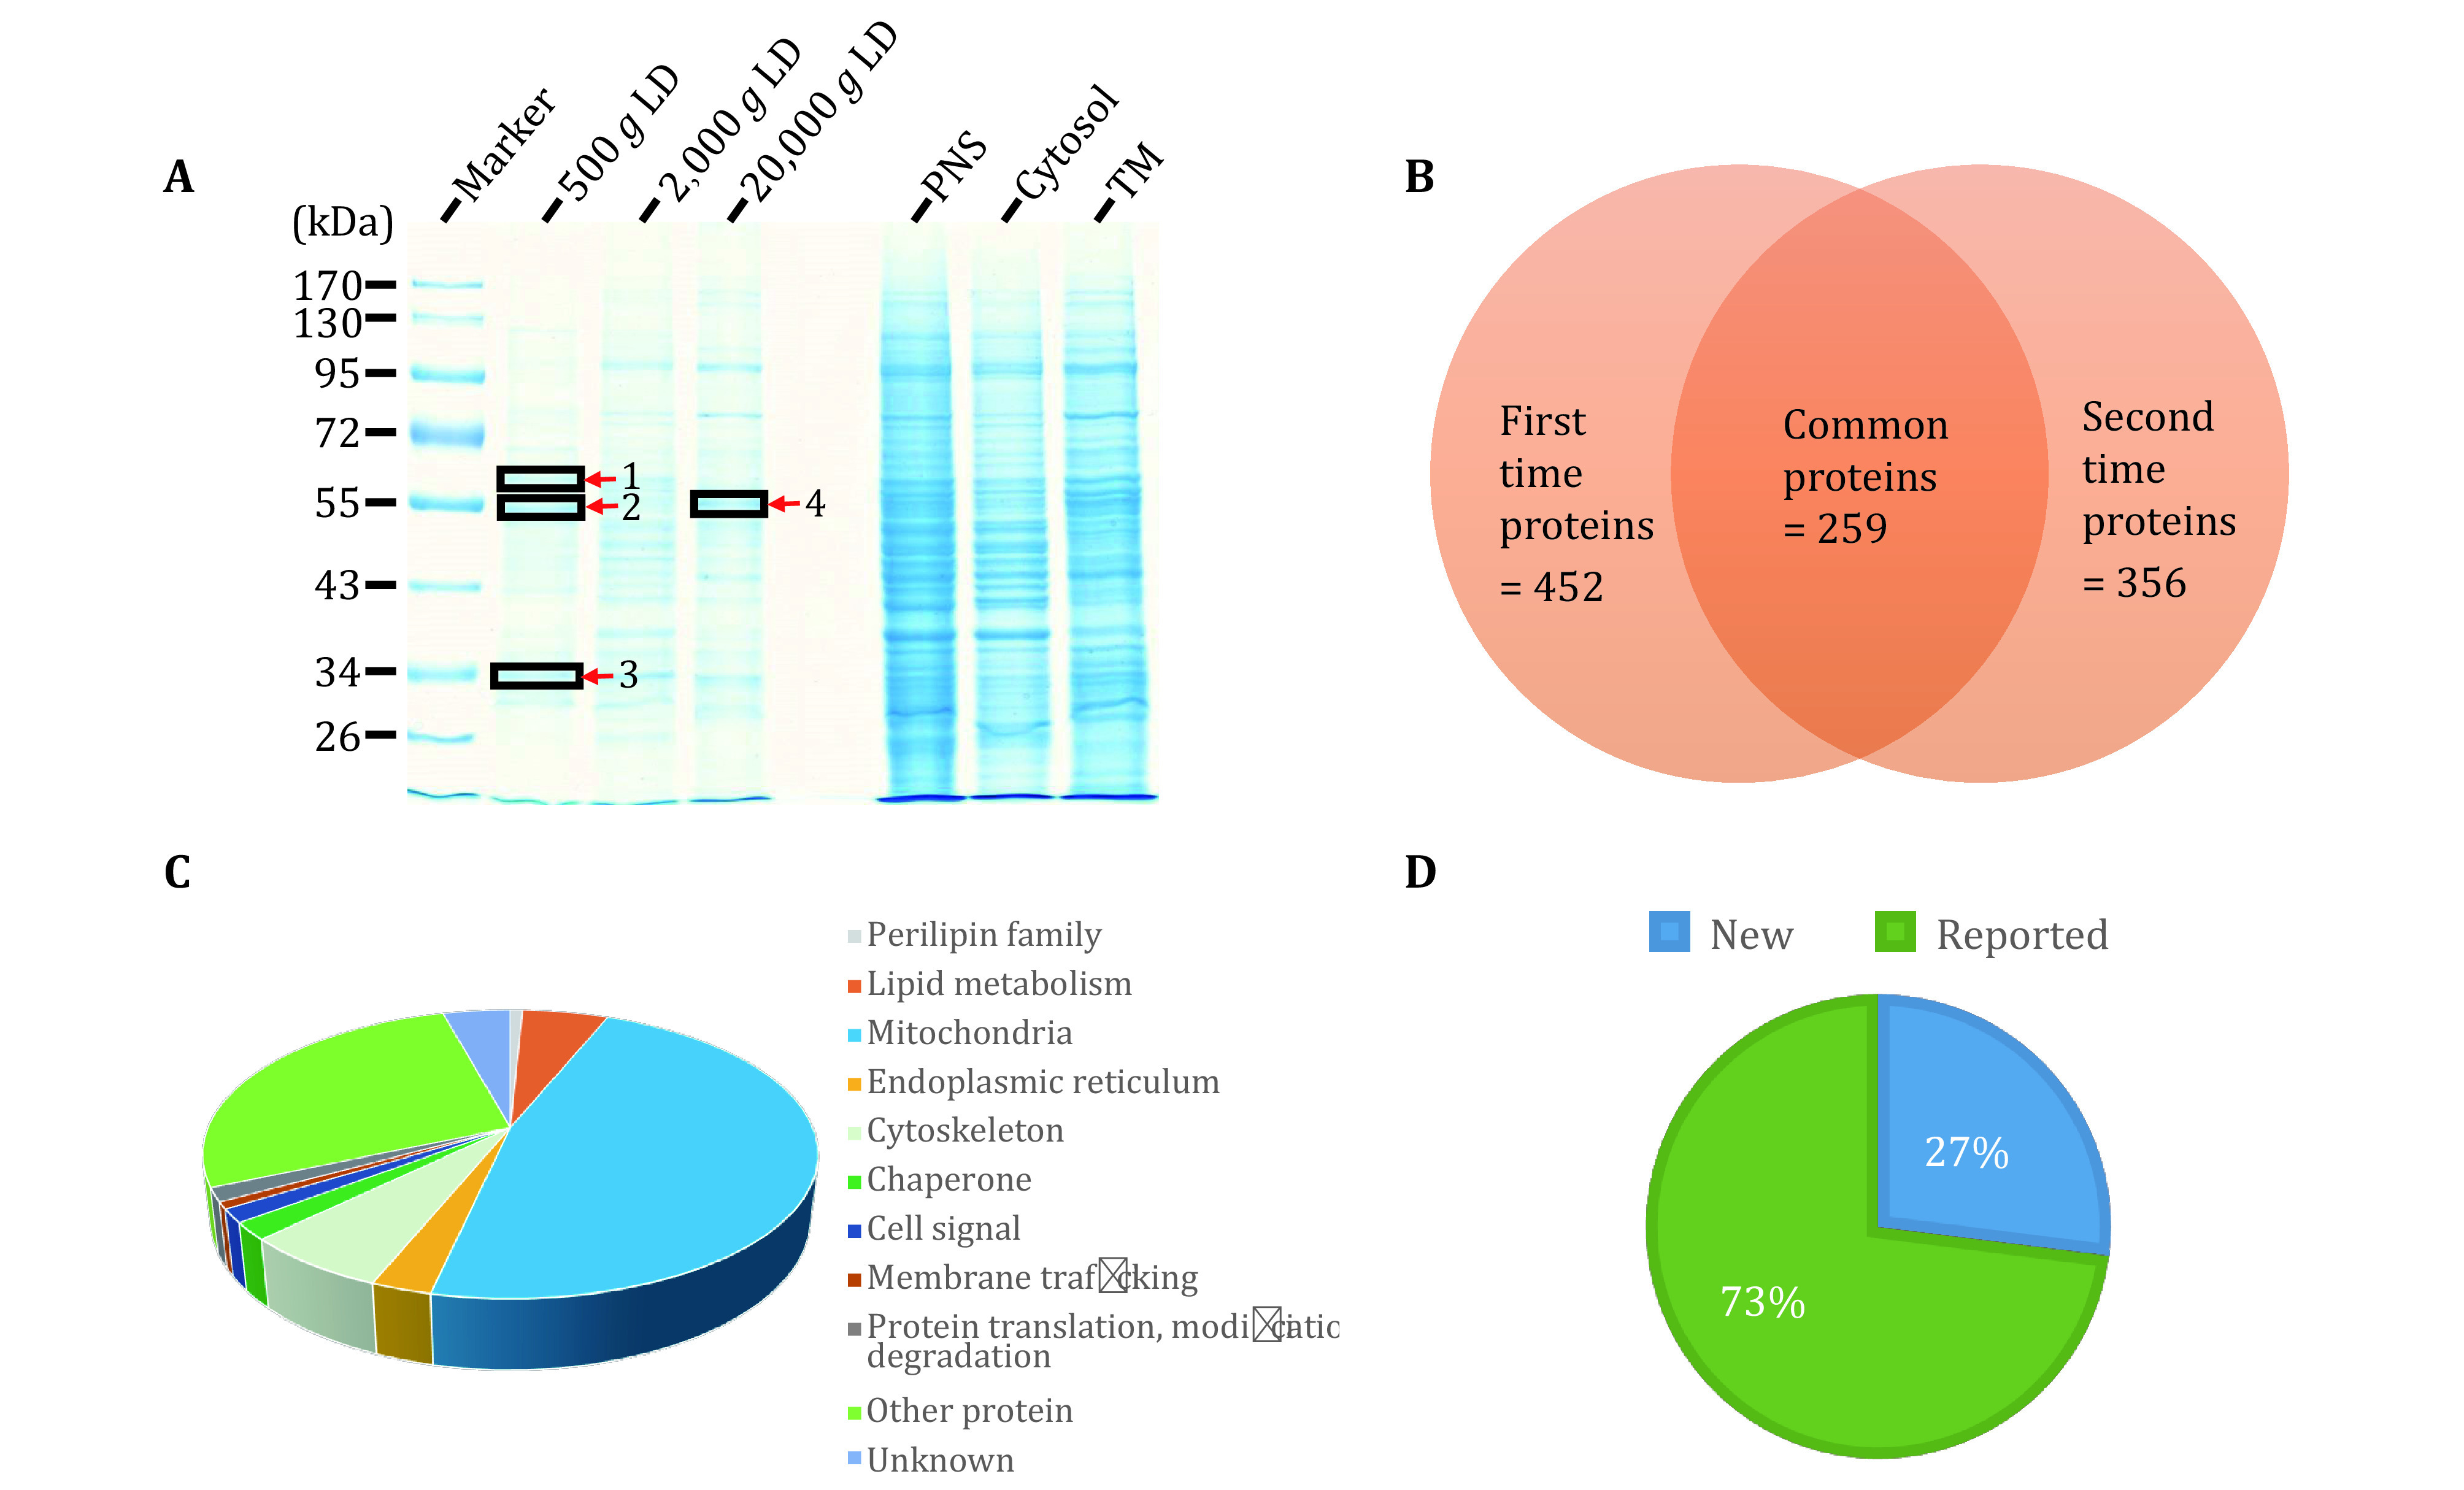
Proteomic analysis of isolated LDs from zebrafish liver. A Proteins were separated by SDS-PAGE after extracting from LD, TM, Cyto, and PNS fractions, and then stained by colloidal blue. Red arrowheads marked unique protein bands of LDs. B Proteins of LDs were precipitated by acetone and then subjected to nano-LC-ESI-LTQ Orbitrap XL MS/MS analysis. The Venn diagram showed the overlap of two independent mass spectrum results. C The 259 proteins of LDs identified in two samples were categorized into 11 groups: perilipin family, lipid metabolism, mitochondria, endoplasmic reticulum, cytoskeleton, chaperone, cell signal, membrane trafficking, protein translation and modification degradation, other protein and unknown function protein. D Proteins of LDs of two independent mass spectrum results were categorized into previously reported proteins and newly identified proteins in this study

Acknowledgments
This image is the copyrighted work of the attributed author or publisher, and ZFIN has permission only to display this image to its users. Additional permissions should be obtained from the applicable author or publisher of the image. Full text @ Biophys Rep