FIGURE

Figure 1

ID
ZDB-FIG-231130-66
Publication
Sun et al., 2023 - Isolation and proteomic study of fish liver lipid droplets
Other Figures
All Figure Page
Back to All Figure Page
Figure 1

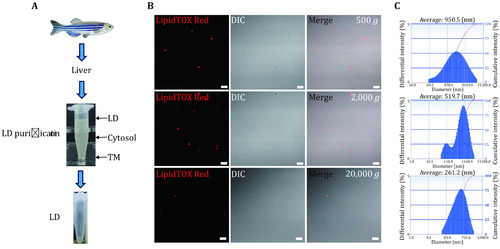
Isolation of LDs from zebrafish liver. A Flowchart of isolation of LDs from zebrafish liver. Livers of adult zebrafishes were collected and homogenized, and the fraction of PNS was collected and subjected to centrifuge at 500 g, 2,000 g and 20,000 g. After centrifugation, the white layer on the top of the gradient was collected as LD fraction, the pellet at the bottom was TM, and the middle solution was collected as Cyto. The LD fraction was then washed three times and kept in an Eppendorf tube for further usage. B Isolated LDs were first analyzed by confocal microscopy with LipidTOX Red staining, DIC imaging, and merged images. Bar = 10 μm. C The size of isolated LDs was measured by a Delsa Nano C particle analyzer

Expression Data

Expression Detail
Antibody Labeling
Phenotype Data

Phenotype Detail
Acknowledgments
This image is the copyrighted work of the attributed author or publisher, and ZFIN has permission only to display this image to its users. Additional permissions should be obtained from the applicable author or publisher of the image. Full text @ Biophys Rep