
- Title
-
Biallelic COQ4 Variants in Hereditary Spastic Paraplegia: Clinical and Molecular Characterization
- Authors
- Lin, X., Jiang, J.Y., Hong, D.J., Lin, K.J., Li, J.J., Chen, Y.J., Qiu, Y.S., Wang, Z., Liao, Y.C., Yang, K., Shi, Y., Wang, M.W., Hsu, S.L., Hong, S., Zeng, Y.H., Chen, X.C., Wang, N., Lee, Y.C., Chen, W.J.
- Source
- Full text @ Mov. Disord.
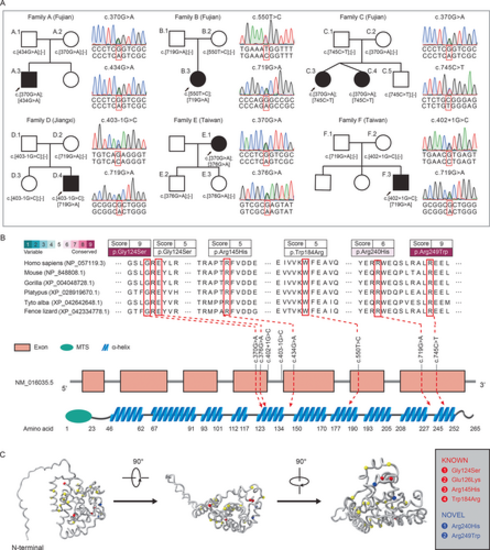
Genetic analysis of families with hereditary spastic paraplegia. (A) Pedigrees of the six HSP (hereditary spastic paraplegia) families harboring compound heterozygous variants in COQ4. Filled and empty symbols represent affected and unaffected individuals, respectively. Arrows indicate the proband in each family. Sanger sequencing traces confirming the compound heterozygous variants in HSP families. Dash symbols in brackets indicate wild-type alleles. (B) Distribution of COQ4 variants and conservation analysis in representative vertebrates. Upper horizontal axis shows a scale of conservation score (1–9) from highly variable to conserved. Lower horizontal axis represents AlphaFold secondary structure prediction for human COQ4 protein (UniProt No. Q9Y3A0). MTS, mitochondrial targeting sequence. (C) Side and top-down views of the human COQ4 structural model. Mapping of mitochondriopathy-related mutations onto the COQ4 protein model (yellow highlight). Gray box summarizes COQ4 variants identified in this study. [Color figure can be viewed at wileyonlinelibrary.com] |
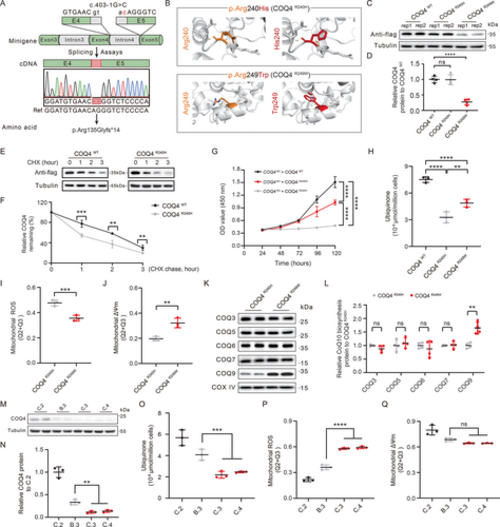
Functional analysis of COQ4 variants. (A) Transcript isoform identification of COQ4 c.403-1G > C using minigene splicing assays. (B) Tertiary molecular structures of COQ4 proteins generated by PyMOL. (C) Overexpression of recombinant WT (wild type) and mutant FLAG-tagged COQ4 (p.R240H and p.R249W) in HEK293T cells. (D) Statistical analysis of (C) (n = 4, one-way ANOVA [analysis of variance]). (E) Representative immunoblotting analysis of R240H COQ4 protein stability by cycloheximide-chase assay. (F) Statistical analysis of (E) (n = 3, univariate analysis). All values are normalized to untreated controls. (G) Growth curves for COQ4-KO (knockout) lines expressing each COQ4 variant (n = 6, one-way ANOVA). (H) Mitochondrial ubiquinone levels in COQ4-KO HEK293T cells expressing the indicated COQ4 variants (n = 4, one-way ANOVA). Statistical analysis of flow cytometry quantification of mitochondrial (I) ROS (reactive oxygen species) and (J) ΔΨm levels in COQ4-KO cells expressing each COQ4 variant (n = 3, t test). (K) Immunoblot analysis of key proteins in the CoQ10 (coenzyme Q10) biosynthesis pathway in mitochondria isolated from COQ4-KO cells expressing the indicated COQ4 variants. (L) Statistical analysis of (K) (n = 4, t test). (M, N) Immunoblot detection and statistical analysis of COQ4 protein levels in fibroblasts (n = 3, one-way ANOVA). (O) Mitochondrial ubiquinone levels in fibroblasts (n = 3, one-way ANOVA). Statistical analysis of flow cytometry quantification of mitochondrial (P) ROS and (Q) ΔΨm levels in fibroblasts (n = 3, one-way ANOVA). [Color figure can be viewed at wileyonlinelibrary.com] |
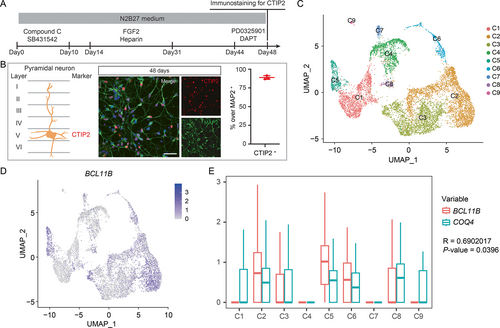
Enriched COQ4 expression in pyramidal neurons. (A) Timeline for differentiation of pyramidal neurons. (B) Schematic of pyramidal neuron layering (left) and marker detection (right). Confirmation and quantification of pyramidal neurons at 48 days by CTIP2 and MAP2 detection. Scale bar, 50 μm. (C) UMAP (uniform manifold approximation and projection) plot of cell subtypes detected in pyramidal neurons at 48 days. (D) Distribution of BCL11B expression in the UMAP plot and (E, Pearson's correlation coefficient) box plot comparison of BCL11B expression with COQ4; y-axis is the log-scale-normalized read count. Box and whiskers: box represents median and IQR (interquartile range), and whiskers represent minimum to maximum range. [Color figure can be viewed at wileyonlinelibrary.com] |
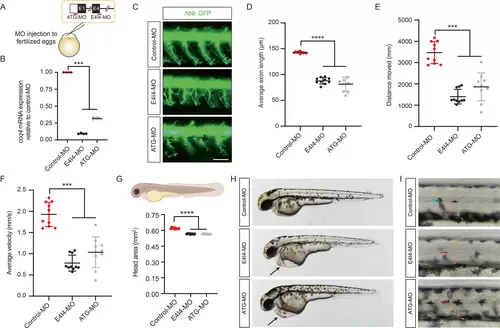
Functional characterization of coq4 in hb9::GFP zebrafish. (A) Schematic for generating coq4-KD larvae. Two coq4-specific MOs (morpholino oligomer, red line) targeting the first translation initiation site (ATG-MO) or the 3′ splicing site in exon 4 (E4I4-MO) were microinjected into fertilized, one-cell-stage zebrafish embryos. (B) QPCR (Quantitative PCR) analysis of coq4 mRNA levels in zebrafish embryos microinjected with control-MO or coq4-MO at 3 dpf (days post fertilization) (n = 4, one-way ANOVA [analysis of variance]). (C) Motor axon growth of hb9::GFP zebrafish embryos at 2 dpf. Scale bar, 100 μm. (D) Average length of motor axons in (C) (n = 10 zebrafish/group, about 30 axons per fish were examined; one-way ANOVA). Locomotor performance was assessed by (E) distance covered and (F) average velocity in coq4-MO larvae at 5 dpf (n = 10 zebrafish/group, one-way ANOVA). (G) Smaller head region (enclosed by dashed line) of coq4-MO larvae compared to control-MO larvae at 6 dpf (n = 10 zebrafish/group, one-way ANOVA). (H, I) Pericardial edema formation (black arrow; H) and U-shaped somites (red arrow; I) in coq4-KD larvae but not in control-MO larvae (blue arrow, chevron-shaped somites) at 2 dpf. [Color figure can be viewed at wileyonlinelibrary.com] |