
Fig. 2
- ID
- ZDB-FIG-240405-3
- Publication
- Lin et al., 2023 - Biallelic COQ4 Variants in Hereditary Spastic Paraplegia: Clinical and Molecular Characterization
- Other Figures
- All Figure Page
- Back to All Figure Page
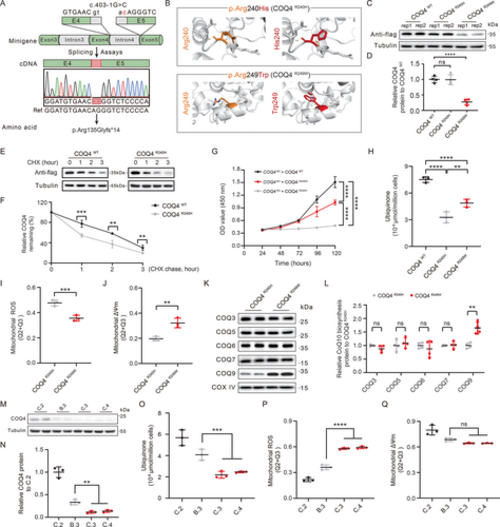
Functional analysis of COQ4 variants. (A) Transcript isoform identification of COQ4 c.403-1G > C using minigene splicing assays. (B) Tertiary molecular structures of COQ4 proteins generated by PyMOL. (C) Overexpression of recombinant WT (wild type) and mutant FLAG-tagged COQ4 (p.R240H and p.R249W) in HEK293T cells. (D) Statistical analysis of (C) (n = 4, one-way ANOVA [analysis of variance]). (E) Representative immunoblotting analysis of R240H COQ4 protein stability by cycloheximide-chase assay. (F) Statistical analysis of (E) (n = 3, univariate analysis). All values are normalized to untreated controls. (G) Growth curves for COQ4-KO (knockout) lines expressing each COQ4 variant (n = 6, one-way ANOVA). (H) Mitochondrial ubiquinone levels in COQ4-KO HEK293T cells expressing the indicated COQ4 variants (n = 4, one-way ANOVA). Statistical analysis of flow cytometry quantification of mitochondrial (I) ROS (reactive oxygen species) and (J) ΔΨm levels in COQ4-KO cells expressing each COQ4 variant (n = 3, t test). (K) Immunoblot analysis of key proteins in the CoQ10 (coenzyme Q10) biosynthesis pathway in mitochondria isolated from COQ4-KO cells expressing the indicated COQ4 variants. (L) Statistical analysis of (K) (n = 4, t test). (M, N) Immunoblot detection and statistical analysis of COQ4 protein levels in fibroblasts (n = 3, one-way ANOVA). (O) Mitochondrial ubiquinone levels in fibroblasts (n = 3, one-way ANOVA). Statistical analysis of flow cytometry quantification of mitochondrial (P) ROS and (Q) ΔΨm levels in fibroblasts (n = 3, one-way ANOVA). [Color figure can be viewed at wileyonlinelibrary.com] |