
|
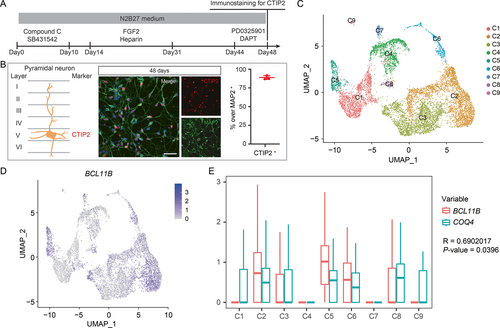
Fig. 3 Enriched COQ4 expression in pyramidal neurons. (A) Timeline for differentiation of pyramidal neurons. (B) Schematic of pyramidal neuron layering (left) and marker detection (right). Confirmation and quantification of pyramidal neurons at 48 days by CTIP2 and MAP2 detection. Scale bar, 50 μm. (C) UMAP (uniform manifold approximation and projection) plot of cell subtypes detected in pyramidal neurons at 48 days. (D) Distribution of BCL11B expression in the UMAP plot and (E, Pearson's correlation coefficient) box plot comparison of BCL11B expression with COQ4; y-axis is the log-scale-normalized read count. Box and whiskers: box represents median and IQR (interquartile range), and whiskers represent minimum to maximum range. [Color figure can be viewed at wileyonlinelibrary.com]