FIGURE SUMMARY
Title

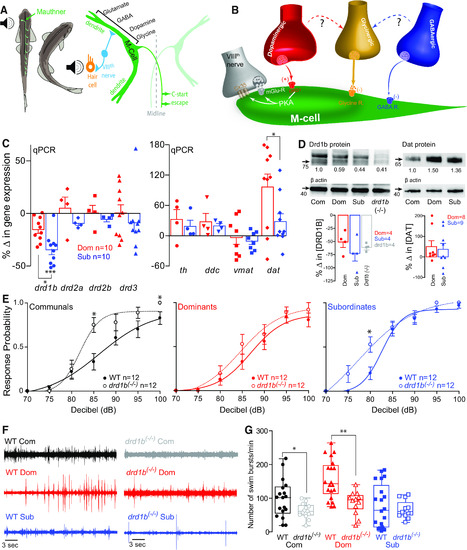
Socially mediated shift in neural circuits activation regulated by synergistic neuromodulatory signaling

Authors
Clements, K.N., Ahn, S., Park, C., Heagy, F.K., Miller, T.H., Kassai, M., Issa, F.A.
Source
Full text @ eNeuro

drd1b expression is socially regulated and necessary for status-dependent regulation of escape and swim circuits. A, Schematic representation of the M-cell escape circuit and descending neuromodulatory inputs known to regulate its activity. B, M-cell receives auditory sensory information from the VIIIth nerve, which is a mixed glutamatergic and electrical synapse. M-cell is also modulated by descending dopaminergic, glycinergic, and GABAergic inputs. C, qPCR expression analysis of DA signaling pathway genes in whole brains (n = 10 pairs). β-Actin (actb2) used as an internal reference gene, and expression from social isolates (n = 10) used for standardization. Bars represent mean and SEM. Zero indicates no change in gene expression relative to isolate control. We performed one-way ANOVA (between-subject factor as group) followed by Tukey’s HSD post hoc test for the group comparisons to compare the percentage changes in gene expressions of drd1b, drd2a, drd2b, drd3, th, ddc, vmat, dat among isolates, dominants, and subordinates. In drd1b, there was a significant main effect of group (F(2,32) = 1.93e+1, p = 3.00e-6). The post hoc test showed a significant decrease in gene expression for subordinates (p = 2.00e-6) and marginal decrease for dominants (p = 6.39e-2) compared with the isolates. The post hoc test also showed a significant decrease in gene expression for subordinates compared with dominants (p = 1.43e-3). In drd2a, drd2b, and drd3, there were no main effects of group (p > 0.05). In th and vmat, there were no effects of group (p > 0.05). In ddc, there was a main effect of group (F(2,14) = 3.95, p = 4.35e-2). Dominant was higher than isolates (p = 4.61e-2). But there were no differences between dominants and subordinates (p > 0.05) and between subordinates and isolates (p > 0.05). In dat, there was a significant main effect of group (F(2,30) = 8.71, p = 1.04e-3). The post hoc test showed a significant increase for dominants compared with isolates (p = 8.69e-4) and subordinates (p = 2.37e-2), but there was no difference between isolates and subordinates (p > 0.05). D, Western blot analysis of Drd1b receptor and DAT with β-actin serving as a control. Protein expression of dominants, subordinates and drd1b(−/−) animals was normalized to WT communal controls as a ratio (ratio values stated below each band). Bar graphs represent average percent change in protein concentration of four replicates of Drd1b samples and five replicates of DAT samples. Each replicate consisted of 10 brains normalized to WT communals. In Drd1b protein and Dat protein, there were no effects of group (p > 0.05; n = 4 replicates of dominants, subordinates, and drd1b(−/−)). E, Comparison of the probability of the startle escape response between WT versus drd1b(−/−) for each social phenotype. Asterisks denote statistical difference at the specified dB level. We performed a mixed design ANOVA (between-subject factor as group, within-subject factor as decibel) followed by two-sample two-sided t test for the post hoc test at each decibel. In communals, there were significant main effects of group (F(1,22) = 4.73, p = 4.08e-2) and decibel (F(3.5,76.3) = 5.85e+1, p < 1.0e-16), and group*decibel interaction (F(3.5,76.3) = 3.21, p = 2.20e-2). We observed that drd1b(−/−) significantly increased the startle response for communal animals. In particular, post hoc test showed that there were significant differences of the startle responses at 85 dB (t(22) = 3.07, p = 5.57e-3), at 100 dB (t(22) = 2.21, p = 3.75e-2), and marginal difference at 95 dB (t(22) = 1.80, p = 8.58e-2). In dominants, there was a significant main effect of decibel (F(3.5,76.4) = 5.54e+1, p < 1.0e-16), but no effect of group (F(1,22) = 1.05e-1, p > 0.05) and no effect of group*decibel interaction (F(3.5,76.4) = 2.83e-1, p > 0.05). In subordinates, there were significant main effects of group (F(1,22) = 4.49, p = 4.57e-2), decibel (F(3.6,78.4) = 1.00e+2, p < 1.0e-16), and marginal group*decibel interaction (F(3.6,78.4) = 2.17, p = 8.79e-2). We observed that drd1b(−/−) significantly increased the startle response for subordinate animals. In particular, post hoc test showed that there were significant differences of the startle responses at 80 dB (t(22) = 2.63, p = 1.52e-2) and at 95 dB (t(22) = 2.13, p = 4.48e-2), and a marginal difference of the startle response at 75 dB (t(22) = 2.03, p = 5.48e-2). F, Comparison of 1 min recordings of far field-potentials of spontaneous swimming activity for WT communals, dominants, and subordinates (left column) and drd1b(−/−) communals, dominants, and subordinates (right column). G, Box and whiskers plots of the average number of swim bursts per 1 min for each social phenotype for WT and drd1b(−/−) animals. Dots represent individual animals. The box extends from the 25th to 75th percentiles, horizontal line is the median, and whiskers represent max/min values. We performed one-way ANOVA (between-subject factor as group) to compare WT and drd1b(−/−) animals. In communals, there was a significant difference between WT (n = 18) and drd1b(−/−) (n = 13) animals (F(1,29) = 4.89, p = 3.50e-2). In dominants, there was a significant difference between WT (n = 20) and drd1b(−/−) (n = 12) animals (F(1,30) = 1.38e+1, p = 8.29e-4). In subordinates, there was no difference between WT (n = 20) and drd1b(−/−) (n = 12) animals (F(1,30) = 2.44e-1, p > 0.05; p values: *p < 0.05, **p < 0.005, ***p < 0.0005).

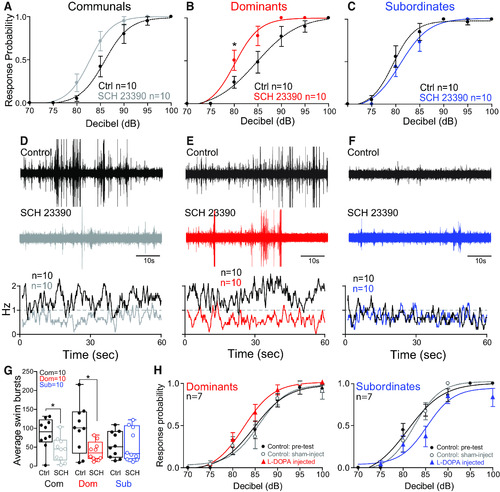
Dopaminergic modulation of the escape and swim circuits is socially regulated. A–C, Probability of startle escape response before (control) and after SCH 23390 injections for communals, dominants, and subordinates, respectively. Asterisks denote statistical difference between control and experimental condition at the specified dB level (*p < 0.05, paired sample t test). We performed repeated measures of ANOVA (within-subject factors as treatment and decibel) followed by one-sample two-sided t test for the post hoc test at each decibel. In communals, there were significant main effects of treatment (F(1,9) = 9.55, p = 1.29e-2) and decibel (F(2.0,17.9) = 9.87e+1, p = 2.21e-10), but no effect of treatment*decibel interaction (F(2.3,20.8) = 1.69, p > 0.05). SCH 23390 significantly increased the overall startle response for communal animals. In particular, post hoc test showed that there was a marginal difference of the startle responses at 90 dB (t(9) = 1.96, p = 8.11e-2). In dominants, there were significant main effects of decibel (F(1.5,13.9) = 7.08e+1, p = 1.39e-7), treatment (F(1,9) = 1.44e+1, p = 4.24e-3), and a marginal treatment*decibel interaction (F(1.8,16.0) = 2.81, p = 9.50e-2). SCH 23390 significantly increased the startle response for dominant animals. In particular, post hoc test showed that there was a significant difference of the startle response at 80 dB (t(9) = 3.02, p = 1.44e-2), and marginal differences at 85 dB (t(9) = 2.20, p = 5.51e-2) and at 90 dB (t(9) = 1.86, p = 9.63e-2). In subordinates, there was a significant main effect of decibel (F(1.4,12.4) = 9.72e+1, p = 9.37e-8), but no effect of treatment (F(1,9) = 8.77e-1, p > 0.05) and no effect of treatment*decibel interaction (F(1.9,17.0) = 8.81e-1, p > 0.05). D–F, One-minute recoding of far field-potentials of spontaneous swimming activity before (control) and after SCH 23390 injections for communal, dominants, and subordinates, respectively, along with respective average swimming frequency for all animals tested (horizontal dashed lines set arbitrarily to compare swim frequencies across experimental conditions). G, Box and whiskers plots of the average number of swim bursts per 1 min for each social phenotype. Box plot parameters are defined in Figure 1G. We performed the repeated measures of ANOVA (within-subject factor as treatment). In communals and dominants, there was a significant effect of treatment (SCH 23390; F(1,9) = 6.06, p = 3.61e-2 for communals; F(1,9) = 1.06e+1, p = 9.88e-3 for dominants). In subordinates, there was no effect of treatment (SCH 23390; F(1,9) = 8.76e-3, p > 0.05). H, Startle response probability before (control) and after injection of L-DOPA for dominant (left) and subordinate (right) zebrafish. Control and experimental data are compared with a second set of control animals that were sham injected with equal volume of reverse osmosis water.

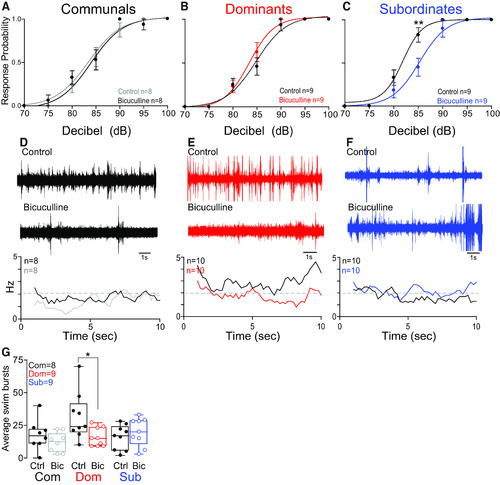
GABAergic modulation of the escape and swim circuits is socially regulated. A–C, Probability of startle escape response before (control) and after bicuculline injections for communals, dominants, and subordinates, respectively. We performed repeated measures of ANOVA (within-subject factors as treatment and decibel) followed by one-sample two-sided t test for the post hoc test at each decibel. In communals, there was a significant main effect of decibel (F(2.6,18.1) = 1.01e+2, p = 3.49e-11), but no effect of treatment (F(1,7) = 2.80e-1, p > 0.05) and no effect of treatment*decibel interaction (F(2.4,17.0) = 7.31e-1, p > 0.05). In dominants, there was a significant main effect of decibel (F(1.9,14.8) = 1.27e+2, p = 6.62e-10), but no effect of treatment (F(1,8) = 1.44, p > 0.05) and no effect of treatment*decibel interaction (F(2.0,16.0) = 1.58, p > 0.05). In subordinates, there were significant main effects of treatment (F(1,8) = 1.18e+1, p = 8.92e-3), decibel (F(2.3,18.1) = 7.53e+1, p = 8.60e-10), and treatment*decibel interaction (F(3.0,23.6) = 3.41, p = 3.44e-2). Bicuculline significantly decreased the startle response for subordinate animals. In particular, post hoc test showed that there was a significant difference at 85 dB (t(8) = 4.60, p = 1.75e-3). Asterisks denote statistical difference between control and experimental condition at the specified dB level: *p < 0.05, **p < 0.005; paired sample t test. D–F, One-minute recording of far field-potentials of spontaneous swimming activity before (control) and after bicuculline injections for communal, dominants, and subordinates, respectively, along with respective average swimming frequency for all animals tested (horizontal dashed lines set arbitrarily to compare swim frequencies across experimental conditions). G, Box and whiskers plots of the average number of swim bursts per 1 min for each social phenotype. Box plot parameters are defined in Figure 1G. We performed the repeated measures of ANOVA (within-subject factor as treatment). In communals and subordinates, there were no effects of treatment (bicuculline; F(1,7) = 2.56, p > 0.05 for communals; F(1,8) = 1.45, p > 0.05 for subordinates). In dominants, there was a significant effect of treatment (bicuculline; F(1,8) = 5.49, p = 4.72e-2).

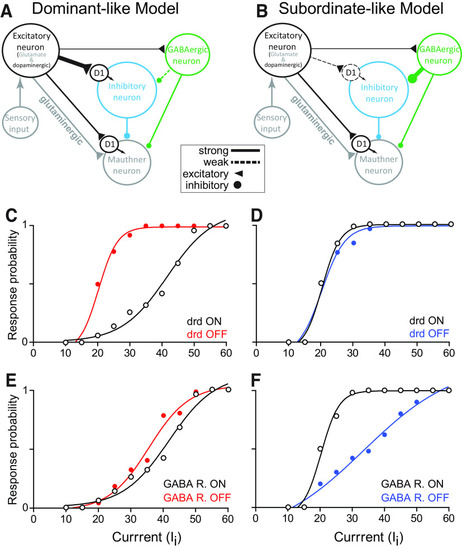
Neurocomputational model. Schematic of dominant-like (A) and subordinate-like (B) neurocomputational models. Thin solid lines, thick solid lines, and thick dashed lines represent regular inputs, strong inputs, and weak inputs, respectively. Dominant-like model was simulated with D1GL=0.65,gGAGL=0.2 for the WT control while subordinate-like model was simulated with D1GL=0.25,gGAGL=0.4 for WT control. C, D, Simulated response of dominant-like (C) and subordinate-like (D) models of escape circuit to positive current injections in the sensory input with/without (ON/OFF) Drd1, thus, mimicking Drd1 antagonism (D1M = 0, D1GL= 0). E, F, simulated response of dominant-like (E) and subordinate-like (F) models of escape circuit to positive current injections in the sensory input with/without (ON/OFF) GABAergic receptor, thus, mimicking GABAergic receptor antagonism (gGAM=0 and gGAGL=0). We also used βGL= 0.024 for dominant-like model and βGL= 0.0072 with subordinate-like model.

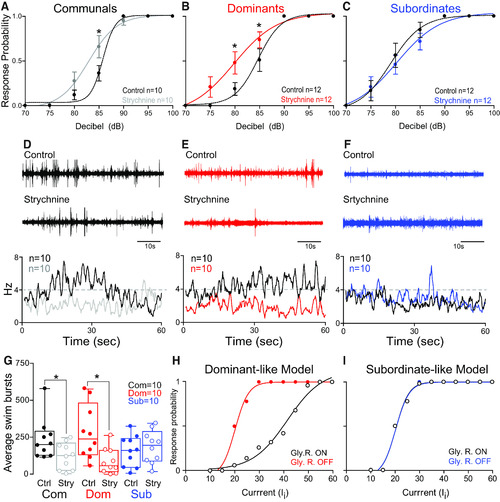
Glycinergic modulation of the escape and swim circuits is socially regulated. A–C, Probability of startle escape response before (control) and after Strychnine injections for communals, dominants, and subordinates, respectively. Asterisks denote statistical difference between control and experimental condition at the specified decibel level. We performed repeated measures of ANOVA (within-subject factors as treatment and decibel) followed by one-sample two-sided t test for the post hoc test at each decibel. In communals, there was a marginal main effect of treatment (F(1,9) = 3.71, p = 8.62e-2), but there were significant main effect of decibel (F(1.5,13.3) = 1.53e+2, p = 8.62e-2) and significant effect of treatment*decibel interaction (F(2.2,19.7) = 3.71, p = 3.96e-2). Strychnine marginally increased startle response for communal animals. In particular, post hoc test showed that there was a significant difference of the startle responses at 85 dB (t(9) = 2.51, p = 3.32e-2). In dominants, there were significant main effect of treatment (F(1,11) = 1.44e+1, p = 2.96e-3), decibel (F(1.9,20.4) = 7.72e+1, p = 5.00e-10), and significant effect of treatment*decibel interaction (F(2.4,25.9) = 4.04, p = 2.45e-2). Strychnine significantly increased the startle response for dominant animals. In particular, post hoc test showed that there was a marginal difference of the startle responses at 75 dB (t(11) = 1.82, p = 9.60e-2), but there were significant differences at 80 dB (t(11) = 2.65, p = 2.24e-2) and 85 dB (t(11) = 2.95, p = 1.33e-2). In subordinates, there was a significant main effect of decibel (F(2.0,21.7) = 5.07e+1, p = 6.99e-9), but no effect of treatment (F(1,11) = 1.60, p > 0.05) and no effect of treatment*decibel interaction (F(2.3,25.8) = 1.28, p > 0.05). D–F, One-minute recording of far field-potentials of spontaneous swimming activity before (control) and after strychnine injections for communal, dominants, and subordinates, respectively, along with respective average swimming frequency for all animals tested (horizontal dashed lines set arbitrarily to compare swim frequencies across experimental conditions). G, Box and whiskers plots of the average number of swim bursts per 1 min for each social phenotype. Box plot parameters are defined in Figure 1G. We performed the repeated measures of ANOVA (within-subject factor as treatment). In communals (n = 10) and dominants (n = 10), there were significant effects of treatment (strychnine; F(1,9) = 6.06, p = 3.61e-2 for communals; F(1,9) = 1.06e+1, p = 9.88e-3 for dominants). In subordinates (n = 10), there was no effect of treatment (strychnine; F(1,9) = 8.76e-3, p > 0.05). H, I, Simulated response of dominant-like (H) and subordinate-like (I) models of escape circuit to positive current injections in the sensory input with/without (ON/OFF) GlyR, thus, mimicking GlyR antagonism (gGLM=0).

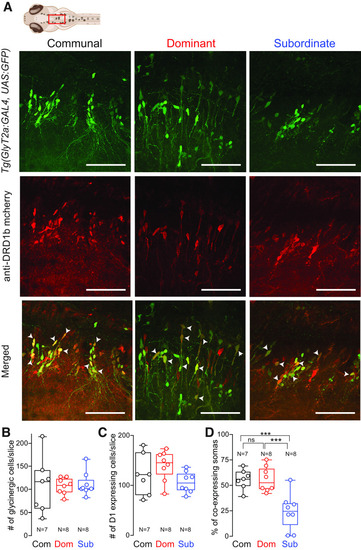
Status-dependent expression of Drd1b in hindbrain glycinergic neurons. A, Representative confocal projections of optical sections of communal, dominant, and subordinate animals. Top row, Images of glycine neurons. Second row, Drd1b staining. Third row, Glycine and Drd1b merged. Arrowheads point to co-expressing cells. Projections, Dashed lines denote midline; anterior is to the left. B–D, Comparing the numbers of glycinergic cells per brain slice (B), the numbers of D1 expressing cells per brain slice (C), and the percentage of co-expression of Drd1b and glycinergic neurons (D) among communal (n = 7), dominant (n = 8), and subordinate (n = 8) animals. We performed one-way ANOVA (between-subject factor as group) followed by Tukey’s HSD post hoc test for the group comparisons. B, There was no effect of group (F(2,20) = 2.81e-1, p > 0.05). C, There was no effect of group (F(2,20) = 2.27, p > 0.05). D, There was a significant main effect of group (F(2,20) = 1.38e+1, p = 1.73e-4). The post hoc tests showed a significant decrease in co-expression for subordinates compared with communals (p = 7.27e-4) and dominants (p = 4.79e-4). Scale bar = 50 μm.

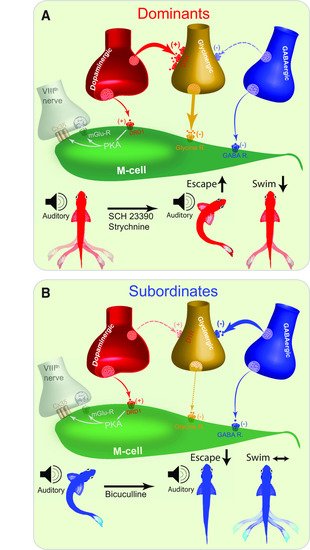
Proposed model of socially mediated shift in synaptic reconfiguration underlies synergistic modulation of the motor circuits. A, Dominants proposed model: the relatively higher Drd1b expression in glycinergic neurons strengthens the dopaminergic→glycinergic synapse, promoting glycine release, and inhibition of the M-cell. The disproportionately stronger dopaminergic→glycinergic pathway compared with the weak GABAergic→glycinergic input culminates in the activation of the glycinergic neurons and lower excitability of the M-cell. Lower panel, Blockage of either Drd1b or GlyR facilities behavioral switch from swimming to escape. B, Subordinates proposed model: the disproportionately weaker dopaminergic→glycinergic pathway because of decreased Drd1b expression in the glycinergic neurons culminates in the reduced activity of the glycinergic neurons and enhanced excitability of the M-cell. Lower panel, Blockage of either Drd1b or GlyR has no effect on escape or swimming activity. However, blockage of GABAergic input promotes dominant like locomotor behavior that promotes swimming over escape. Proposed strong pathways are illustrated as solid colors, while weak pathways are illustrated as faded colors. (+) denotes excitatory synapse, (−) denotes inhibitory synapse.

Acknowledgments
This image is the copyrighted work of the attributed author or publisher, and ZFIN has permission only to display this image to its users. Additional permissions should be obtained from the applicable author or publisher of the image. Full text @ eNeuro