IMAGE

Figure 4.

ID
ZDB-IMAGE-231129-26
Source
Figures for Clements et al., 2023
Image
Figure Caption

Figure 4.

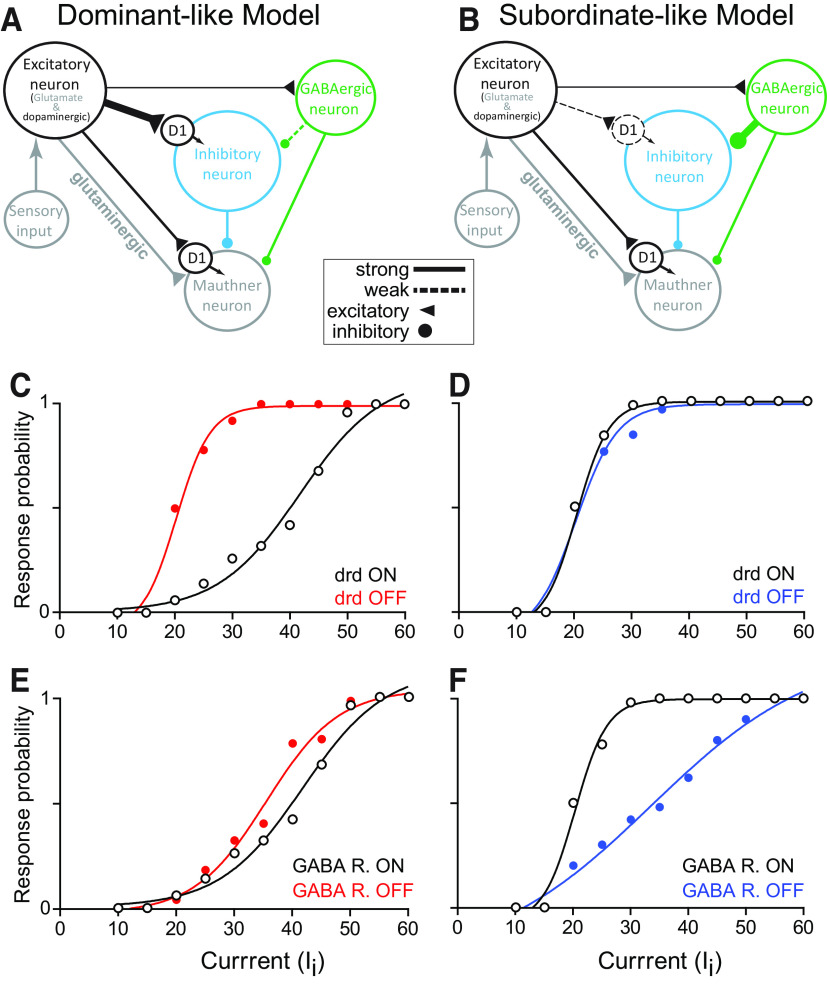
Neurocomputational model. Schematic of dominant-like (A) and subordinate-like (B) neurocomputational models. Thin solid lines, thick solid lines, and thick dashed lines represent regular inputs, strong inputs, and weak inputs, respectively. Dominant-like model was simulated with D1GL=0.65,gGAGL=0.2 for the WT control while subordinate-like model was simulated with D1GL=0.25,gGAGL=0.4 for WT control. C, D, Simulated response of dominant-like (C) and subordinate-like (D) models of escape circuit to positive current injections in the sensory input with/without (ON/OFF) Drd1, thus, mimicking Drd1 antagonism (D1M = 0, D1GL= 0). E, F, simulated response of dominant-like (E) and subordinate-like (F) models of escape circuit to positive current injections in the sensory input with/without (ON/OFF) GABAergic receptor, thus, mimicking GABAergic receptor antagonism (gGAM=0 and gGAGL=0). We also used βGL= 0.024 for dominant-like model and βGL= 0.0072 with subordinate-like model.

Acknowledgments
This image is the copyrighted work of the attributed author or publisher, and ZFIN has permission only to display this image to its users. Additional permissions should be obtained from the applicable author or publisher of the image. Full text @ eNeuro