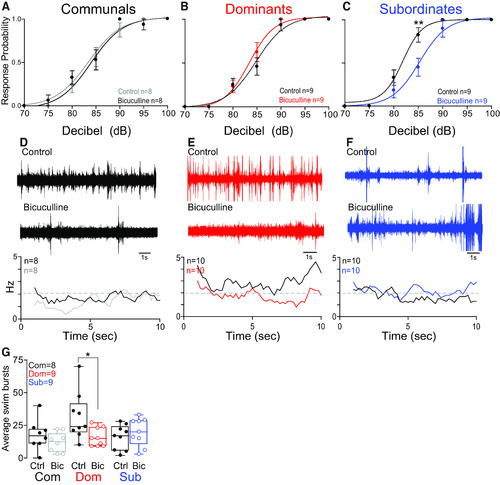
GABAergic modulation of the escape and swim circuits is socially regulated. A–C, Probability of startle escape response before (control) and after bicuculline injections for communals, dominants, and subordinates, respectively. We performed repeated measures of ANOVA (within-subject factors as treatment and decibel) followed by one-sample two-sided t test for the post hoc test at each decibel. In communals, there was a significant main effect of decibel (F(2.6,18.1) = 1.01e+2, p = 3.49e-11), but no effect of treatment (F(1,7) = 2.80e-1, p > 0.05) and no effect of treatment*decibel interaction (F(2.4,17.0) = 7.31e-1, p > 0.05). In dominants, there was a significant main effect of decibel (F(1.9,14.8) = 1.27e+2, p = 6.62e-10), but no effect of treatment (F(1,8) = 1.44, p > 0.05) and no effect of treatment*decibel interaction (F(2.0,16.0) = 1.58, p > 0.05). In subordinates, there were significant main effects of treatment (F(1,8) = 1.18e+1, p = 8.92e-3), decibel (F(2.3,18.1) = 7.53e+1, p = 8.60e-10), and treatment*decibel interaction (F(3.0,23.6) = 3.41, p = 3.44e-2). Bicuculline significantly decreased the startle response for subordinate animals. In particular, post hoc test showed that there was a significant difference at 85 dB (t(8) = 4.60, p = 1.75e-3). Asterisks denote statistical difference between control and experimental condition at the specified dB level: *p < 0.05, **p < 0.005; paired sample t test. D–F, One-minute recording of far field-potentials of spontaneous swimming activity before (control) and after bicuculline injections for communal, dominants, and subordinates, respectively, along with respective average swimming frequency for all animals tested (horizontal dashed lines set arbitrarily to compare swim frequencies across experimental conditions). G, Box and whiskers plots of the average number of swim bursts per 1 min for each social phenotype. Box plot parameters are defined in Figure 1G. We performed the repeated measures of ANOVA (within-subject factor as treatment). In communals and subordinates, there were no effects of treatment (bicuculline; F(1,7) = 2.56, p > 0.05 for communals; F(1,8) = 1.45, p > 0.05 for subordinates). In dominants, there was a significant effect of treatment (bicuculline; F(1,8) = 5.49, p = 4.72e-2).
|
