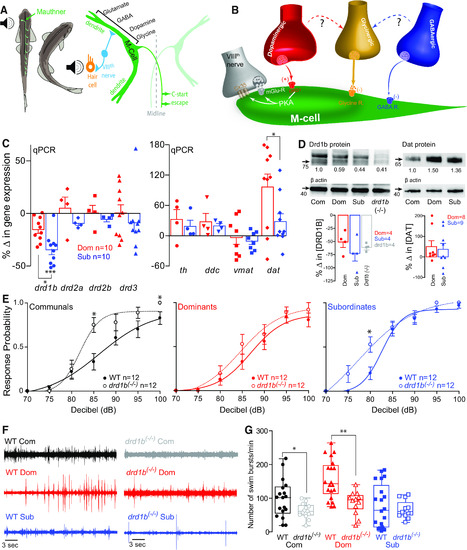
drd1b expression is socially regulated and necessary for status-dependent regulation of escape and swim circuits. A, Schematic representation of the M-cell escape circuit and descending neuromodulatory inputs known to regulate its activity. B, M-cell receives auditory sensory information from the VIIIth nerve, which is a mixed glutamatergic and electrical synapse. M-cell is also modulated by descending dopaminergic, glycinergic, and GABAergic inputs. C, qPCR expression analysis of DA signaling pathway genes in whole brains (n = 10 pairs). β-Actin (actb2) used as an internal reference gene, and expression from social isolates (n = 10) used for standardization. Bars represent mean and SEM. Zero indicates no change in gene expression relative to isolate control. We performed one-way ANOVA (between-subject factor as group) followed by Tukey’s HSD post hoc test for the group comparisons to compare the percentage changes in gene expressions of drd1b, drd2a, drd2b, drd3, th, ddc, vmat, dat among isolates, dominants, and subordinates. In drd1b, there was a significant main effect of group (F(2,32) = 1.93e+1, p = 3.00e-6). The post hoc test showed a significant decrease in gene expression for subordinates (p = 2.00e-6) and marginal decrease for dominants (p = 6.39e-2) compared with the isolates. The post hoc test also showed a significant decrease in gene expression for subordinates compared with dominants (p = 1.43e-3). In drd2a, drd2b, and drd3, there were no main effects of group (p > 0.05). In th and vmat, there were no effects of group (p > 0.05). In ddc, there was a main effect of group (F(2,14) = 3.95, p = 4.35e-2). Dominant was higher than isolates (p = 4.61e-2). But there were no differences between dominants and subordinates (p > 0.05) and between subordinates and isolates (p > 0.05). In dat, there was a significant main effect of group (F(2,30) = 8.71, p = 1.04e-3). The post hoc test showed a significant increase for dominants compared with isolates (p = 8.69e-4) and subordinates (p = 2.37e-2), but there was no difference between isolates and subordinates (p > 0.05). D, Western blot analysis of Drd1b receptor and DAT with β-actin serving as a control. Protein expression of dominants, subordinates and drd1b(−/−) animals was normalized to WT communal controls as a ratio (ratio values stated below each band). Bar graphs represent average percent change in protein concentration of four replicates of Drd1b samples and five replicates of DAT samples. Each replicate consisted of 10 brains normalized to WT communals. In Drd1b protein and Dat protein, there were no effects of group (p > 0.05; n = 4 replicates of dominants, subordinates, and drd1b(−/−)). E, Comparison of the probability of the startle escape response between WT versus drd1b(−/−) for each social phenotype. Asterisks denote statistical difference at the specified dB level. We performed a mixed design ANOVA (between-subject factor as group, within-subject factor as decibel) followed by two-sample two-sided t test for the post hoc test at each decibel. In communals, there were significant main effects of group (F(1,22) = 4.73, p = 4.08e-2) and decibel (F(3.5,76.3) = 5.85e+1, p < 1.0e-16), and group*decibel interaction (F(3.5,76.3) = 3.21, p = 2.20e-2). We observed that drd1b(−/−) significantly increased the startle response for communal animals. In particular, post hoc test showed that there were significant differences of the startle responses at 85 dB (t(22) = 3.07, p = 5.57e-3), at 100 dB (t(22) = 2.21, p = 3.75e-2), and marginal difference at 95 dB (t(22) = 1.80, p = 8.58e-2). In dominants, there was a significant main effect of decibel (F(3.5,76.4) = 5.54e+1, p < 1.0e-16), but no effect of group (F(1,22) = 1.05e-1, p > 0.05) and no effect of group*decibel interaction (F(3.5,76.4) = 2.83e-1, p > 0.05). In subordinates, there were significant main effects of group (F(1,22) = 4.49, p = 4.57e-2), decibel (F(3.6,78.4) = 1.00e+2, p < 1.0e-16), and marginal group*decibel interaction (F(3.6,78.4) = 2.17, p = 8.79e-2). We observed that drd1b(−/−) significantly increased the startle response for subordinate animals. In particular, post hoc test showed that there were significant differences of the startle responses at 80 dB (t(22) = 2.63, p = 1.52e-2) and at 95 dB (t(22) = 2.13, p = 4.48e-2), and a marginal difference of the startle response at 75 dB (t(22) = 2.03, p = 5.48e-2). F, Comparison of 1 min recordings of far field-potentials of spontaneous swimming activity for WT communals, dominants, and subordinates (left column) and drd1b(−/−) communals, dominants, and subordinates (right column). G, Box and whiskers plots of the average number of swim bursts per 1 min for each social phenotype for WT and drd1b(−/−) animals. Dots represent individual animals. The box extends from the 25th to 75th percentiles, horizontal line is the median, and whiskers represent max/min values. We performed one-way ANOVA (between-subject factor as group) to compare WT and drd1b(−/−) animals. In communals, there was a significant difference between WT (n = 18) and drd1b(−/−) (n = 13) animals (F(1,29) = 4.89, p = 3.50e-2). In dominants, there was a significant difference between WT (n = 20) and drd1b(−/−) (n = 12) animals (F(1,30) = 1.38e+1, p = 8.29e-4). In subordinates, there was no difference between WT (n = 20) and drd1b(−/−) (n = 12) animals (F(1,30) = 2.44e-1, p > 0.05; p values: *p < 0.05, **p < 0.005, ***p < 0.0005).
|
