
- Title
-
Structural basis for inactivation of PRC2 by G-quadruplex RNA
- Authors
- Song, J., Gooding, A.R., Hemphill, W.O., Love, B.D., Robertson, A., Yao, L., Zon, L.I., North, T.E., Kasinath, V., Cech, T.R.
- Source
- Full text @ Science
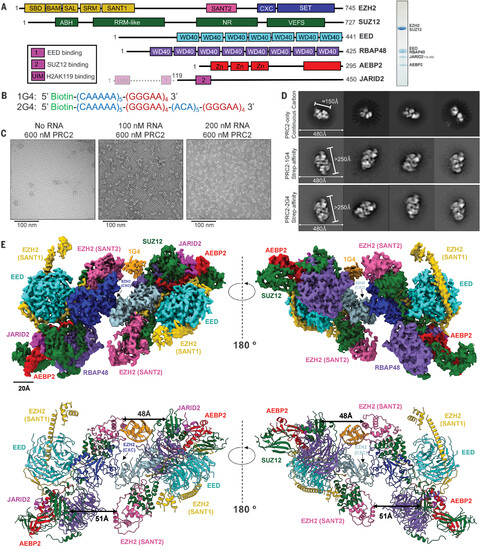
Overall structure of a PRC2-1G4 RNP complex. (A) (Left) Schematic of the proteins in the PRC2.2 six-subunit complex. Transparent N-terminal region of JARID2 was not included. (Right) Coomassie-stained gel of purified PRC2. (B) The two RNA oligonucleotides used in this study. (C) Negative-staining EM images of streptavidin-affinity grids with excess PRC2 and various 1G4 RNA concentrations. (D) Negative-staining EM provided 2D-class averages of PRC2 alone collected from continuous carbon grids and PRC2-G4 RNAs from streptavidin-affinity grids. (E) (Top) Cryo-EM density map of PRC2 bound to 1G4 RNA. EZH2 (CXC-SET) of protomer 1 in blue, EZH2 (CXC-SET) of protomer 2 in light blue, and 1G4 RNA in orange. (Bottom) The atomic model of PRC2 bound to 1G4 RNA. Distances between EZH2 (SANT2) and SUZ12 (RRM-like) are highlighted by black arrows to emphasize the change from 1G4-binding. |
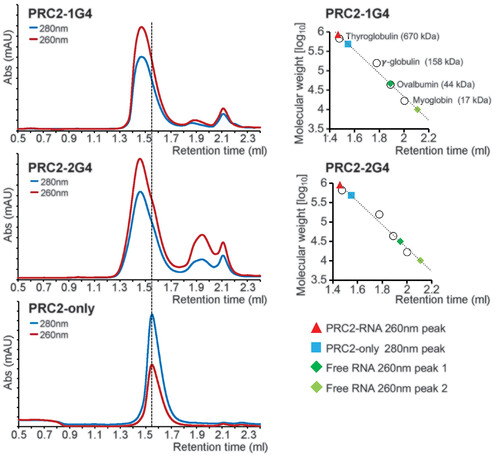
G4 RNA induces PRC2 dimerization in solution. (Left) Size-exclusion chromatography of PRC2 preincubated with 1G4, 2G4, and mock (protein only). Abs, absorbance; mAU, milli–absorbance unit. (Right) Standard curves were used to estimate the molecular weights of PRC2 complexes. |
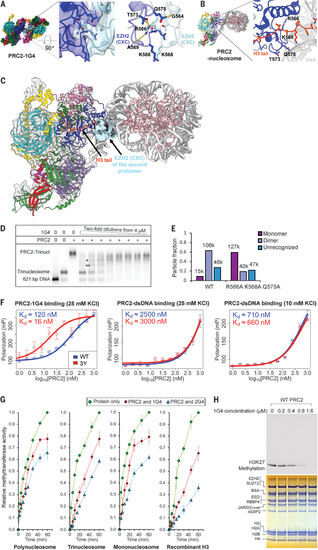
RNA-mediated PRC2 dimer is an inactive complex. (A) Cryo-EM structure of PRC2-1G4 complex with zoom-in to show the interface of two EZH2 CXC domains. Interacting residues (R566, K568, T573, and Q575) are highlighted in the stick representation. One set of hydrogen bonds (R566NE-T573OG1, 2.70-Å distance; R566NH1-A569O, 2.73-Å distance; and Q575NE2-G564O, 2.51-Å distance) is indicated by yellow dashed lines. The other set of hydrogen bonds between the same amino acid pairs in the second PRC2 protomer is not shown for clarity. Another view of the same region is shown in fig. S3G. (B) Structure of PRC2-nucleosome complex (PDB: 6WKR) with zoom-in to emphasize the CXC interactions with nucleosome H3 tail (orange). The same residues as shown in (A) are highlighted in stick representation. (C) Superposition of the EZH2 CXC domain of the RNA-bound PRC2 on the nucleosome-bound PRC2 to emphasize disparate functions of the CXC domain. (D) Nucleosome-RNA competition assay. PRC2 was incubated with constant amount of radiolabeled trinucleosome and serial dilutions of 1G4 RNA. Incomplete PRC2-trinucleosome complexes are indicated by * and **. We assume two of three nucleosomes were occupied by PRC2 in *, and one of three nucleosomes in **. (E) Negative-stain EM to quantify monomer and dimer particles of EZH2 R566A K568A Q575A binding 1G4. The number of particles in each class is indicated above each bar. (F) Binding affinity of 1G4 RNA or dsDNA to WT PRC2 and EZH2 R566Y K568Y W575Y (3Y) measured by FP. We used a reaction buffer with a lower salt concentration to achieve higher binding affinity for the dsDNA (right). Kd, dissociation constant. (G) Methyltransferase activities from figs. S12 to S15 are plotted against reaction times for PRC2 (400 nM) preincubated with 1G4 (400 nM), 2G4 (400 nM), and mock (protein only). Error bars represent standard deviations of three replicates performed on different days. (H) Methylation of trinucleosomes by PRC2 with serial dilutions of 1G4 RNA. (Top) Radiogram that shows methylation. (Bottom) Coomassie-stained gel. Single-letter abbreviations for the amino acid residues are as follows: A, Ala; C, Cys; D, Asp; E, Glu; F, Phe; G, Gly; H, His; I, Ile; K, Lys; L, Leu; M, Met; N, Asn; P, Pro; Q, Gln; R, Arg; S, Ser; T, Thr; V, Val; W, Trp; and Y, Tyr. |
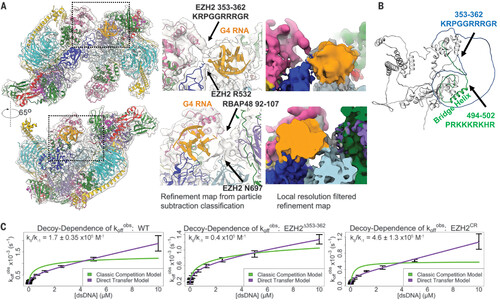
EZH2 loops physically contact G4 RNA and contribute to direct handoff from RNA to DNA. (A) Map of PRC2-1G4 RNA from particle subtraction and classification (fig. S6) with zoom-ins to emphasize the observed physical interactions of PRC2 and G4 RNA. (B) EZH2 structure from AlphaFold predicts two disordered loops of EZH2. Arginine-rich loop [EZH2(353–362)] and lysine-rich loop [EZH2(494–502)] are indicated in blue and green, respectively. (C) FP assays to monitor the transfer kinetics of PRC2 from fluorescently labeled 1G4 RNA to a dsDNA competitor. The ratio kθ/k–1 of the PRC2 RNA-to-dsDNA direct-transfer rate constant (kθ) and the PRC2-RNA dissociation rate constant (k–1) provides a measure of the propensity of PRC2 to exchange these ligands by the direct transfer mechanism. WT PRC2 had kθ = 90 ± 11 M−1s−1, k–1 = 5.6 ± 0.49 × 10⁴ s−1, and kθ/k–1 = 1.7 ± 0.35 × 10⁵ M−1. EZH2 ∆353–362 had kθ = 48 M−1s−1, k–1 = 12 × 104 s−1, and kθ/k–1 = 0.4 × 10⁵ M−1. EZH2 CR had kθ = 130 ± 62 M−1s−1, k–1 = 2.7 ± 0.63 × 10⁴ s−1, and kθ/k–1 = 4.6 ± 1.3 × 10⁵ M−1. koffobs, dissociation rate constant observed. |
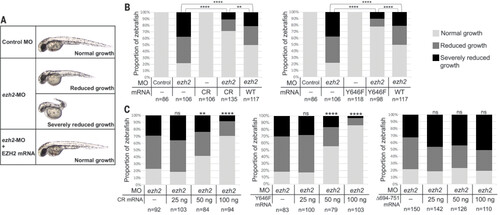
EZH2 CR is a gain-of-function mutant in rescue of zebrafish development. (A) Representative images of injected zebrafish embryos at 48 hours post fertilization (hpf). Gross phenotypic scoring of anterior-posterior axis growth was sorted into three categories: normal, reduced, and severely reduced growth. (B) Scoring of anterior-posterior axis growth at 48 hpf. Zebrafish embryos were injected with 4-ng ezh2-MO or the same amount of control MO. For rescue experiments, 100 ng of mRNA encoding WT or mutated human EZH2 was coinjected with ezh2-MO. At least three clutches were examined for each injection. Fisher’s exact test was used to determine the P values. (C) Dose-response experiments with 25, 50, and 100 ng of mRNA coinjected. Statistical analyses were performed as in (B) by comparing different doses with ezh2-MO alone. ns, not significant; *P < 0.05; **P < 0.01; ***P < 0.001; ****P < 0.0001. |