
- Title
-
The Effect of the Pyrethroid Pesticide Fenpropathrin on the Cardiac Performance of Zebrafish and the Potential Mechanism of Toxicity
- Authors
- Saputra, F., Lai, Y.H., Roldan, M.J.M., Alos, H.C., Aventurado, C.A., Vasquez, R.D., Hsiao, C.D.
- Source
- Full text @ Biology (Basel)
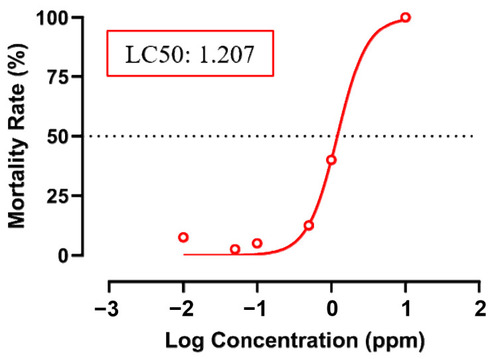
Mortality rate of zebrafish embryos after incubation in several concentrations of fenpropathrin and the LC50 value. Red line show the non-linear curve for the LC50 calculation. |
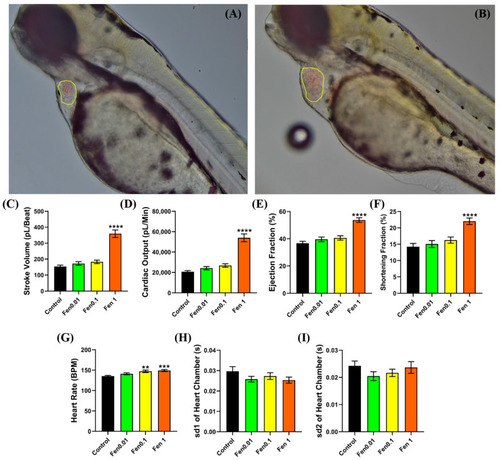
Ventricle chamber of the control group ( |

Condition of the dorsal aorta of control group ( |
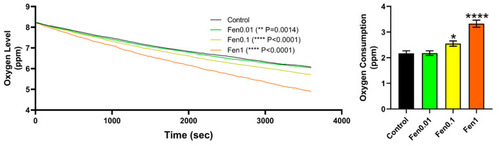
Oxygen consumption rate of zebrafish after exposure to fenpropathrin. The left graph depicts the oxygen level over time, showing a clear increase in oxygen consumption. The right graph shows the total oxygen consumption of zebrafish at the end of the test, which was significantly higher for fenpropathrin-exposed group compared to control group. Two-Way ANOVA was conducted to calculate the significant difference in the oxygen level over time between each treatment, and Geisser–Greenhouse correction was performed for multiple comparison tests. The data for total oxygen consumption were presented as mean ± SEM, and the statistical significance was calculated using Ordinary One-Way ANOVA with Dunnet multiple comparison test. ( |
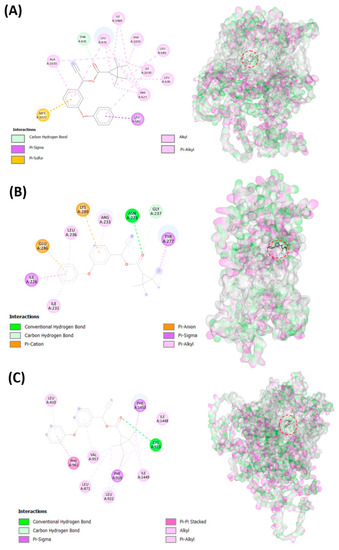
Graphical representation of the binding position of fenpropathrin into voltage-gated calcium (cacna1sb ( |
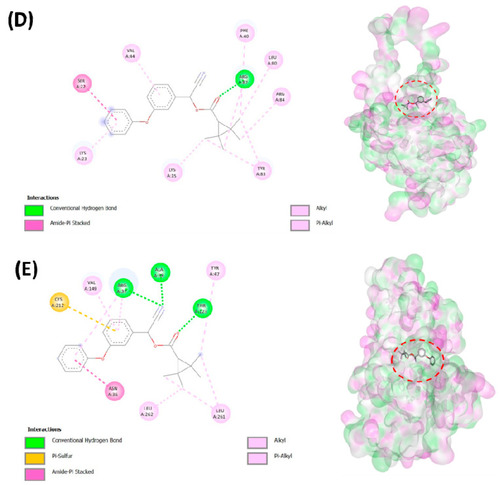
Graphical representation of the binding position of fenpropathrin into voltage-gated calcium (cacna1sb ( |
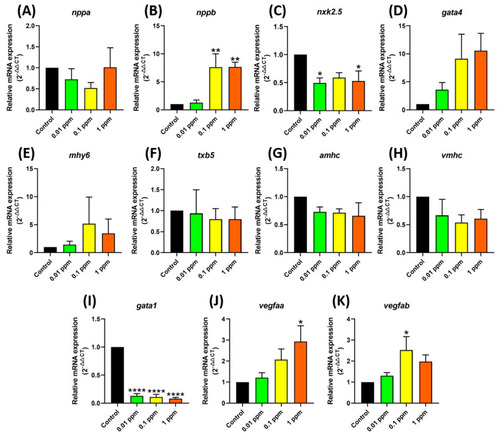
Expression of genes related to cardiovascular development after exposure to fenpropathrin. The data were presented as mean ± SEM, and the statistical significance was calculated using Ordinary One-Way ANOVA with Dunnet multiple comparison test. ( |
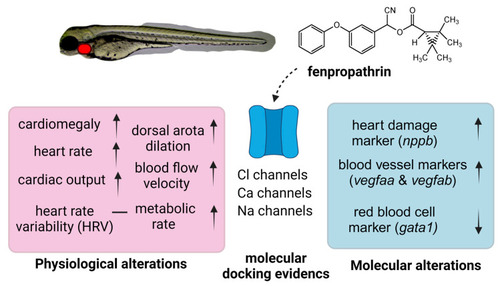
Proposed mechanism of fenpropathrin-induced cardiovascular toxicity in zebrafish. The physiological evidence was collected from cardiovascular and metabolic assays and is highlighted in red. The molecular evidence was collected from mRNA expression assay and is highlighted in blue. Some indirect evidence collected from molecular docking is highlighted with dotted arrow. |