IMAGE

Figure 3

ID
ZDB-IMAGE-231002-407
Source
Figures for Saputra et al., 2023
Image
Figure Caption

Figure 3

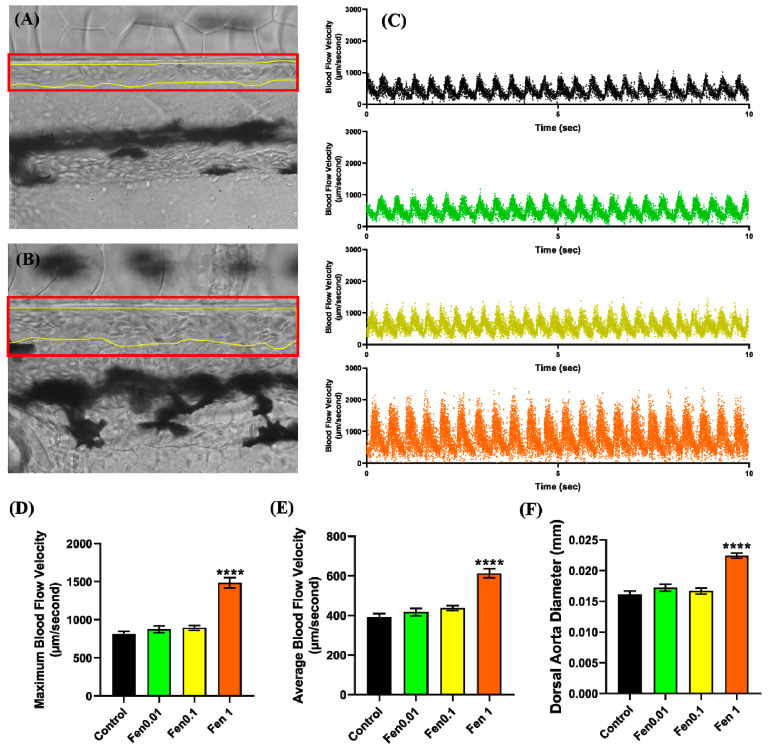
Condition of the dorsal aorta of control group (A) and the 1 ppm fenpropathrin-treated group (B). The yellow line represents the border of the dorsal aorta, while the red box represents its position for high-speed videography. (C) The blood flow velocity profile in the dorsal aorta following incubation in fenpropathrin concentrations of either zero (black), 0.01 (green), 0.1 (yellow), or 1 ppm (orange). (D) Maximum blood flow velocity, (E) average blood flow velocity, and (F) dorsal aorta diameter following 24 h of acute incubation in fenpropathrin. The data were presented as mean ± SEM, and the statistical significance was determined using Ordinary One-Way ANOVA with the Dunnet multiple comparison test. (**** p < 0.0001).

Acknowledgments
This image is the copyrighted work of the attributed author or publisher, and ZFIN has permission only to display this image to its users. Additional permissions should be obtained from the applicable author or publisher of the image. Full text @ Biology (Basel)