
Image
|
Figure Caption
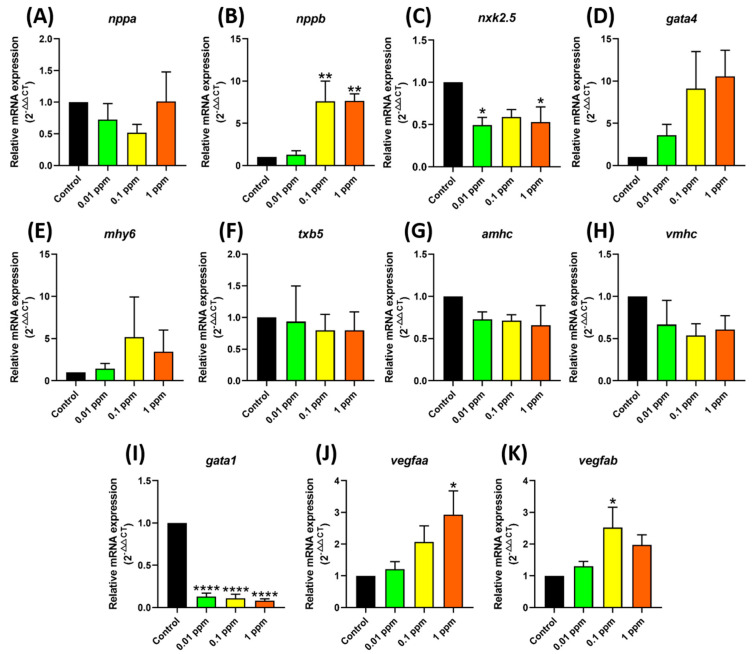
Figure 6
Expression of genes related to cardiovascular development after exposure to fenpropathrin. The data were presented as mean ± SEM, and the statistical significance was calculated using Ordinary One-Way ANOVA with Dunnet multiple comparison test. (
Acknowledgments
This image is the copyrighted work of the attributed author or publisher, and
ZFIN has permission only to display this image to its users.
Additional permissions should be obtained from the applicable author or publisher of the image.
Full text @ Biology (Basel)