
Image
|
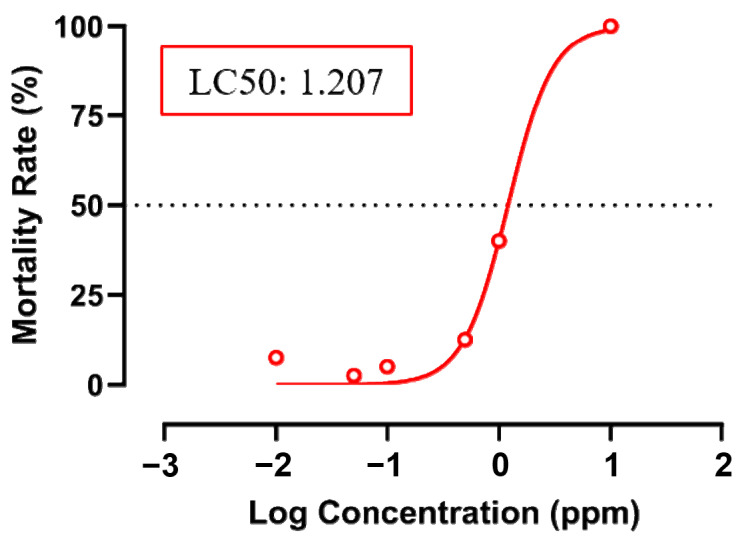
Figure Caption
Figure 1
Mortality rate of zebrafish embryos after incubation in several concentrations of fenpropathrin and the LC50 value. Red line show the non-linear curve for the LC50 calculation.
Acknowledgments
This image is the copyrighted work of the attributed author or publisher, and
ZFIN has permission only to display this image to its users.
Additional permissions should be obtained from the applicable author or publisher of the image.
Full text @ Biology (Basel)