
- Title
-
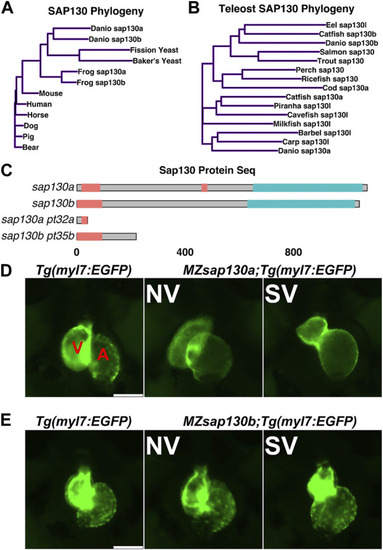
Sin3a associated protein 130 kDa, sap130, plays an evolutionary conserved role in zebrafish heart development
- Authors
- DeMoya, R.A., Forman-Rubinsky, R.E., Fontaine, D., Shin, J., Watkins, S.C., Lo, C.W., Tsang, M.
- Source
- Full text @ Front Cell Dev Biol
PHENOTYPE:
|

|

Cardiac gene expression in EXPRESSION / LABELING:
PHENOTYPE:
|

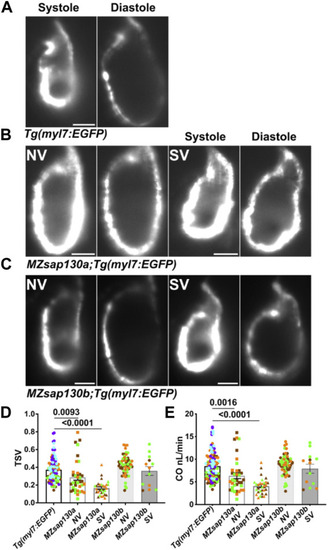
RNAseq reveals cardiac contraction and conduction is altered in PHENOTYPE:
|
PHENOTYPE:
|

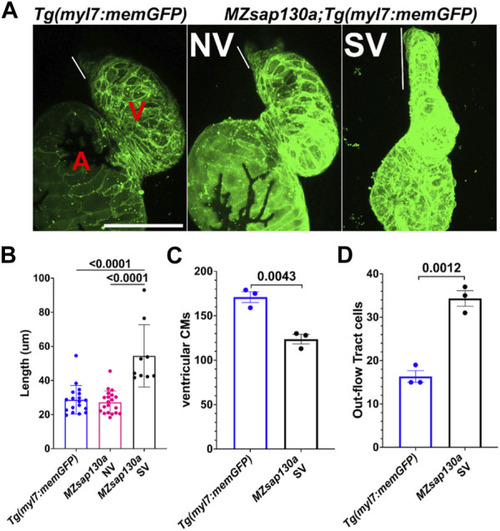
Lineage tracing reveal changes to SHF in |
PHENOTYPE:
|
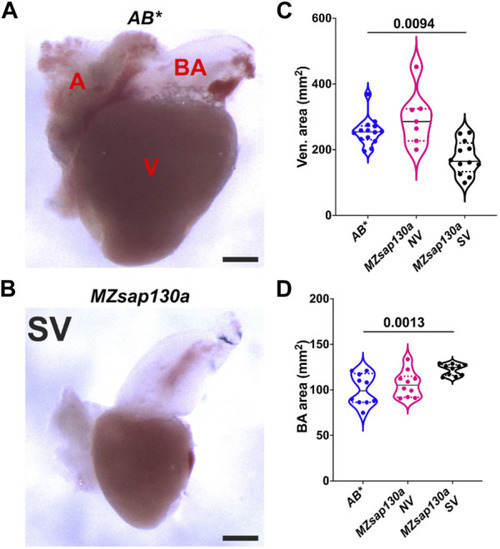
Adult PHENOTYPE:
|
PHENOTYPE:
|

ZFIN is incorporating published figure images and captions as part of an ongoing project. Figures from some publications have not yet been curated, or are not available for display because of copyright restrictions. PHENOTYPE:
|
|
ZFIN is incorporating published figure images and captions as part of an ongoing project. Figures from some publications have not yet been curated, or are not available for display because of copyright restrictions. |
|
Unillustrated author statements PHENOTYPE:
|