
- Title
-
Stability and function of RCL1 are dependent on interaction with BMS1
- Authors
- Wang, Y., Zhao, Z., Yu, H., Shi, H., Tao, B., He, Y., Chen, J., Peng, J., Gan, M., Lo, L.J.
- Source
- Full text @ J. Mol. Cell Biol.
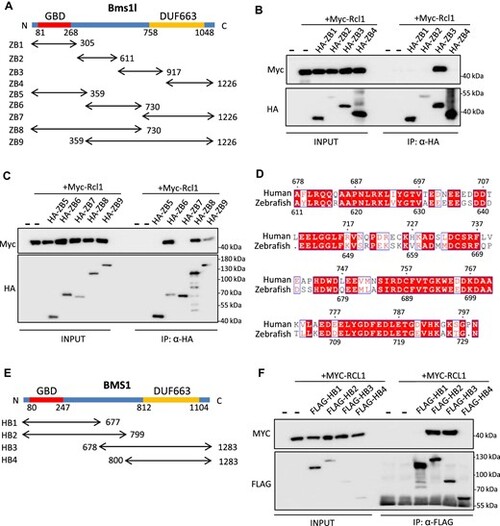
RCL1-interacting domain in BMS1 is conserved in zebrafish and humans. (A) Diagram illustrating zebrafish ZB1–ZB9. ZB1–ZB4 were divided evenly and ZB5–ZB9 were divided based on domain structure by sequence alignment with yeast Bms1. GBD, GTP-binding domain; DUF663, protein of unknown function. (B and C) Co-IP analysis of interactions between Myc-Rcl1 and HA-tagged ZB1–ZB4 (B) and ZB5–ZB9 (C). HA beads were used to pull down HA-tagged ZB fragments. ZB3, ZB6, ZB8, and ZB9 interacted with Rcl1. (D) Amino acid sequence alignment between 611–730 aa region of zebrafish Bms1l and 678–799 aa region of human BMS1. Red boxes represent identical amino acids. (E) Diagram illustrating human HB1–HB4 based on predicted interacting domain. (F) Co-IP analysis of interactions between MYC-RCL1 and FLAG-tagged HB1–HB4. Flag beads were used to pull down FLAG-tagged HB fragments. Both HB2 and HB3 interacted with RCL1. |
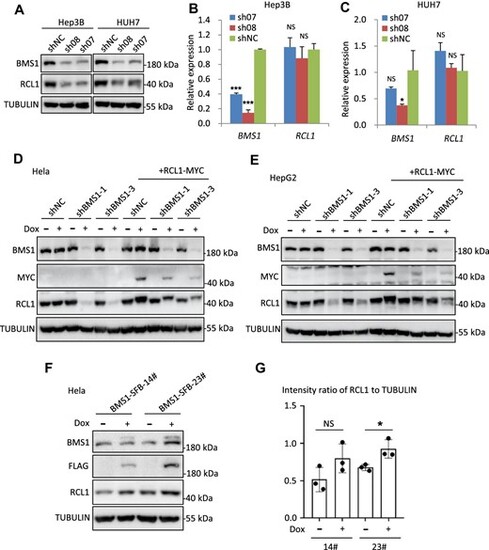
Human RCL1 protein stability is dependent on BMS1 protein level. (A) Western blot analysis of BMS1 and RCL1 protein levels in Hep3B and HUH7 cells after BMS1 knockdown by sh08 and sh07. shNC, negative control. TUBULIN: loading control. (B and C) qPCR analysis of the transcriptional levels of BMS1 and RCL1 in Hep3B (B) and HUH7 (C) cells after BMS1 knockdown by sh08 and sh07. The qPCR values were normalized against GAPDH and expressed as fold change of expression. (D and E) Western blot analysis of BMS1, RCL1 and RCL1-MYC protein levels after BMS1 knockdown and RCL1-MYC overexpression in Hela (D) or HepG2 (E) cells by doxycycline (Dox) treatment. (F and G) Western blot analysis of BMS1, BMS1-SFB, and RCL1 in monoclonal Hela cell lines (14# and 23#) with or without Dox treatment. The intensity ratio of RCL1 to TUBULIN was calculated. The data are presented as mean ± SEM. ***P < 0.001; *P < 0.05; NS, no significance. |
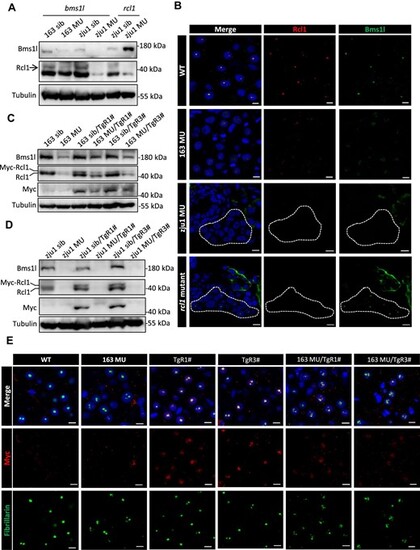
Protein stability of Rcl1 is dependent on Bms1l protein level in zebrafish. (A) Western blot analysis of Bms1l and Rcl1 protein levels in zebrafish at 5 dpf. Tubulin: loading control. 163 sib, bms1lsq163/+ and WT siblings; 163 MU, bms1lsq163/sq163 mutant; zju1 sib, bms1lzju1/+ or rcl1zju1/+ and the corresponding WT siblings; zju1 MU, bms1lzju1/zju1 or rcl1zju1/zju1 mutant. (B) Immunofluorescence staining of Rcl1 and Bms1l in WT, bms1lsq163/sq163 (163 MU), bms1lzju1/zju1(zju1 MU), and rcl1zju1/zju1 mutant at 5 dpf. Blue signal represents nucleus staining by DAPI. Dotted box indicates liver region. Scale bar, 5 μm. (C and D) Western blot analysis of Bms1l, Rcl1 and Rcl1-Myc protein levels in bms1lsq163/sq163 mutant and siblings (C) or bms1lzju1/zju1 mutant and siblings (D) with or without the background of TgR1# or TgR3# at 5 dpf. (E) Immunofluorescence staining of Myc and the nucleolar marker fibrillarin to demonstrate the localization of Rcl1-Myc in hepatocytes of WT, bms1lsq163/sq163mutant, TgR1#, TgR3#, bms1lsq163/sq163/TgR1#, and bms1lsq163/sq163/TgR3# at 5 dpf. Blue signal represents nucleus staining by DAPI. Scale bar, 5 μm. |
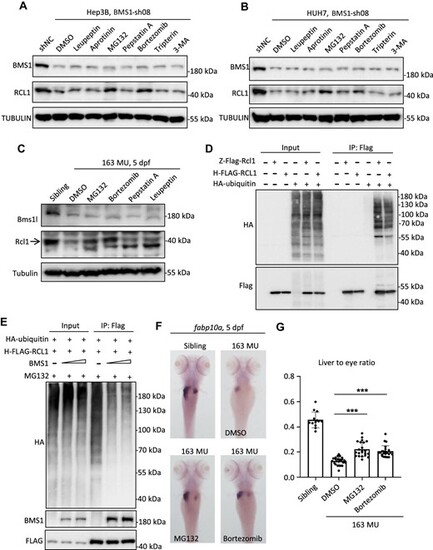
RCL1 is degraded through the ubiquitination–proteasome pathway. (A and B) After BMS1 knockdown by sh08, Hep3B (A) or HUH7 (B) cells were treated with leupeptin, aprotinin, MG132, pepstatin A, bortezomib, tripterin, or 3-MA, followed by western blot analysis to examine protein levels of BMS1 and RCL1. DMSO: negative control. (C) bms1lsq163/sq163 mutant zebrafish were treated with MG132, bortezomib, pepstatin A, or leupeptin from 2 dpf to 5 dpf, followed by western blot analysis to examine protein levels of Bms1l and Rcl1 at 5 dpf. (D) Co-IP analysis of interactions between HA-ubiquitin and zebrafish Flag-Rcl1 (Z-Flag-Rcl1) or human FLAG-RCL1 (H-FLAG-RCL1). (E) Co-IP analysis of interactions among HA-ubiquitin, H-FLAG-RCL1, and BMS1. The transfected 293T cells were treated with MG132 for 24 h before cell harvest. (F and G) WISH analysis using liver-specific fabp10a probe in bms1lsq163/sq163 mutant and siblings after MG132 or bortezomib treatment at 5 dpf. The area ratio of liver to eye was calculated. ***P < 0.001. |
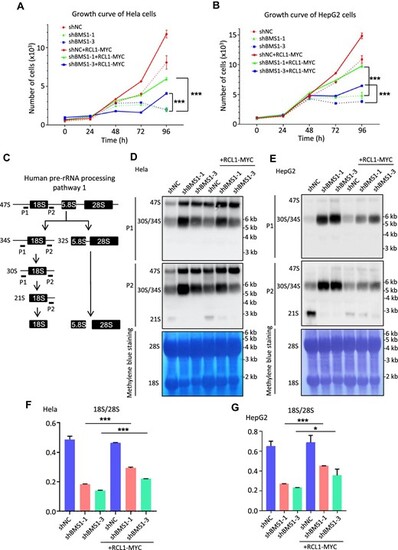
RCL1 overexpression rescues 18S rRNA production and cell growth after BMS1 knockdown. (A and B) Cell growth of Hela (A) or HepG2 (B) cells as indicated was determined by using Cell Counting Kit-8 every 24 h from 0 to 96 h. For each time point, five repeats of one sample were set. (C) Diagram illustrating human pre-rRNA processing pathway 1. Probes used for northern blot analysis were shown as P1 and P2. (D and E) Northern blot analysis of pre-rRNA processing using biotin-labeled P1 and P2 probes in Hela (D) and HepG2 (E) cells after doxycycline treatment. Methylene blue staining was used to indicate 28S and 18S rRNA levels. (F and G) Detection of 18S/28S rRNA ratio by Agilent 2100 in Hela (F) and HepG2 (G) cells. ***P < 0.001; *P < 0.05. |
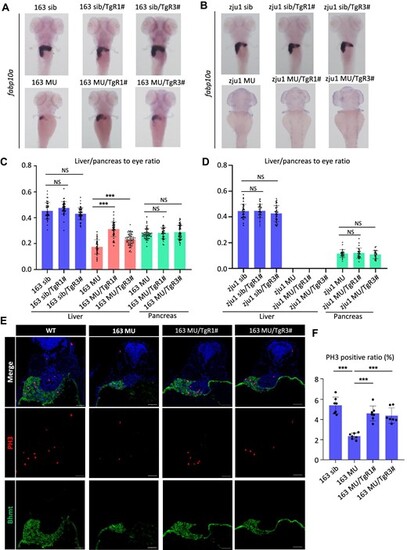
Hepatocyte-specific overexpression of Rcl1 partially rescues liver dysplasia in bms1lsq163/sq163mutant but not bms1lzju1/zju1mutant. (A–D) WISH was performed using liver-specific fabp10a probe (A and B) and the area ratio of liver or pancreas to eye was calculated (C and D) in bms1lsq163/sq163mutant and siblings (A) or bms1lzju1/zju1 mutant and siblings (B) with or without the background of TgR1# or TgR3# at 5 dpf. (E and F) Immunofluorescence staining of PH3 and Bhmt (E) and the ratio of PH3-positive hepatocytes to total hepatocytes (F) in WT, bms1lsq163/sq163 mutant, bms1lsq163/sq163/TgR1#, and bms1lsq163/sq163/TgR3# at 3 dpf. Bhmt is a marker of the liver and yolk. Blue signal represents nucleus staining by DAPI. Scale bar, 40 μm. NS, no significance; ***P < 0.001. |
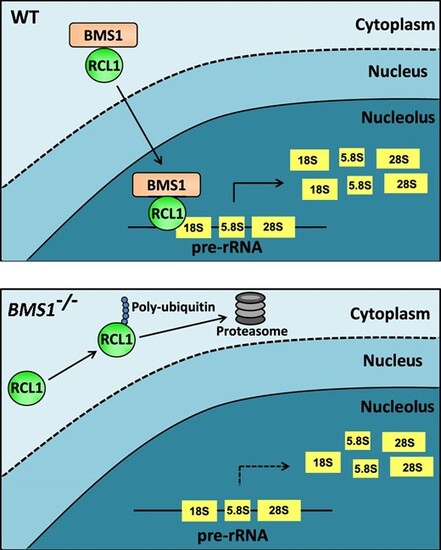
Schematic diagram of BMS1 and RCL1 interaction. In WT cells, RCL1 is transported into the nucleolus to execute 18S rRNA processing and maturation by interacting with BMS1 (upper). In BMS1-mutant cells, RCL1 that fails to enter the nucleus is poly-ubiquitinated and degraded by proteasome, eventually leading to the reduction of 18S rRNA level and cell growth arrest (lower). |