
|
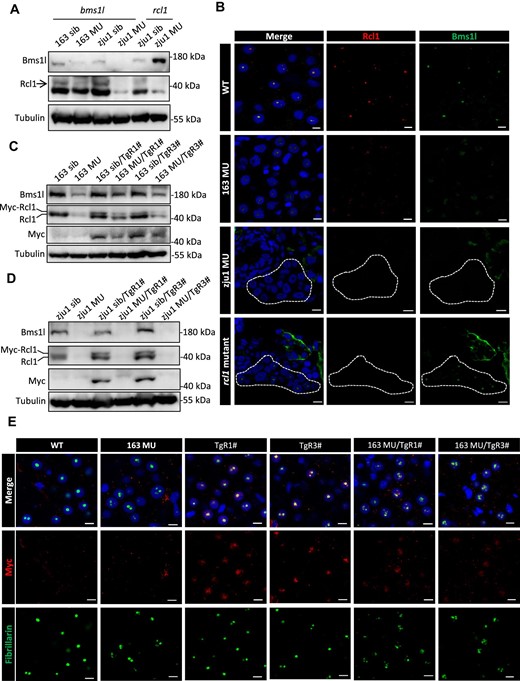
Fig. 3 Protein stability of Rcl1 is dependent on Bms1l protein level in zebrafish. (A) Western blot analysis of Bms1l and Rcl1 protein levels in zebrafish at 5 dpf. Tubulin: loading control. 163 sib, bms1lsq163/+ and WT siblings; 163 MU, bms1lsq163/sq163 mutant; zju1 sib, bms1lzju1/+ or rcl1zju1/+ and the corresponding WT siblings; zju1 MU, bms1lzju1/zju1 or rcl1zju1/zju1 mutant. (B) Immunofluorescence staining of Rcl1 and Bms1l in WT, bms1lsq163/sq163 (163 MU), bms1lzju1/zju1(zju1 MU), and rcl1zju1/zju1 mutant at 5 dpf. Blue signal represents nucleus staining by DAPI. Dotted box indicates liver region. Scale bar, 5 μm. (C and D) Western blot analysis of Bms1l, Rcl1 and Rcl1-Myc protein levels in bms1lsq163/sq163 mutant and siblings (C) or bms1lzju1/zju1 mutant and siblings (D) with or without the background of TgR1# or TgR3# at 5 dpf. (E) Immunofluorescence staining of Myc and the nucleolar marker fibrillarin to demonstrate the localization of Rcl1-Myc in hepatocytes of WT, bms1lsq163/sq163mutant, TgR1#, TgR3#, bms1lsq163/sq163/TgR1#, and bms1lsq163/sq163/TgR3# at 5 dpf. Blue signal represents nucleus staining by DAPI. Scale bar, 5 μm.