
|
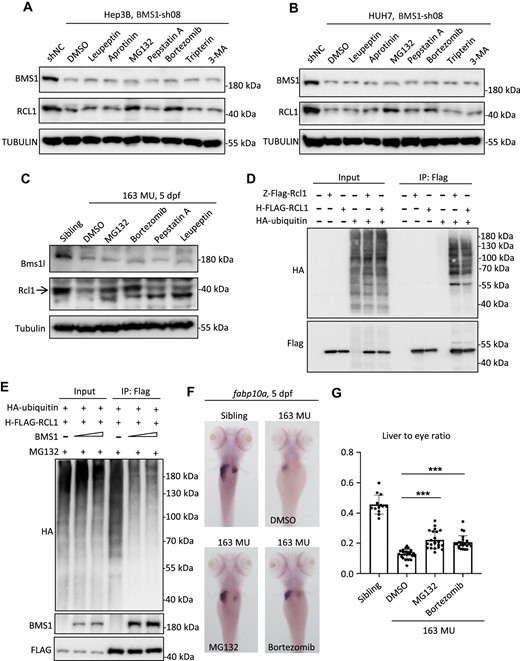
Fig. 4 RCL1 is degraded through the ubiquitination–proteasome pathway. (A and B) After BMS1 knockdown by sh08, Hep3B (A) or HUH7 (B) cells were treated with leupeptin, aprotinin, MG132, pepstatin A, bortezomib, tripterin, or 3-MA, followed by western blot analysis to examine protein levels of BMS1 and RCL1. DMSO: negative control. (C) bms1lsq163/sq163 mutant zebrafish were treated with MG132, bortezomib, pepstatin A, or leupeptin from 2 dpf to 5 dpf, followed by western blot analysis to examine protein levels of Bms1l and Rcl1 at 5 dpf. (D) Co-IP analysis of interactions between HA-ubiquitin and zebrafish Flag-Rcl1 (Z-Flag-Rcl1) or human FLAG-RCL1 (H-FLAG-RCL1). (E) Co-IP analysis of interactions among HA-ubiquitin, H-FLAG-RCL1, and BMS1. The transfected 293T cells were treated with MG132 for 24 h before cell harvest. (F and G) WISH analysis using liver-specific fabp10a probe in bms1lsq163/sq163 mutant and siblings after MG132 or bortezomib treatment at 5 dpf. The area ratio of liver to eye was calculated. ***P < 0.001.