
- Title
-
Transcriptome Profiling Reveals Enhanced Mitochondrial Activity as a Cold Adaptive Strategy to Hypothermia in Zebrafish Muscle
- Authors
- Cahill, T., Chan, S., Overton, I.M., Hardiman, G.
- Source
- Full text @ Cells

A schematic diagram showing the establishment of the torpor+radiation group (18.5-mel-rad). This group was acclimated at 18.5 °C from 28.5 °C, over a 4-week period to avoid thermal shock. They were administered 24 µM on the start of the experimental timeline, with radiation exposure of 16.34 cGy occurring on the 2nd and 8th days of the timeline for a total of wholebody dose of 32.68 cGy. The fish were then sacrificed on the 10th day. |
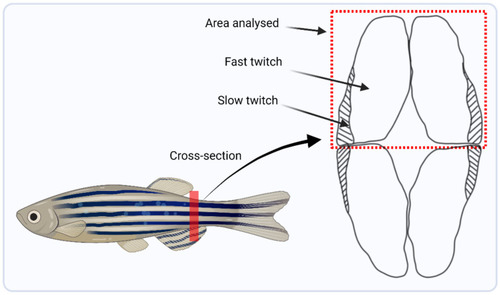
Schematic diagram highlighting the trunk location from where muscle was harvested, marked by the red line, and a lateral cross-sectional area showing the dorsal region of muscle that was dissected for RNA and DNA extraction for downstream analysis. |
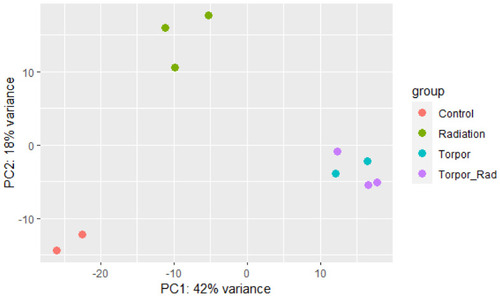
Principle component analysis plot showing samples of each experimental group clustering based on similarity. The plot shows distinct clustering between the control group (red), the radiation group (green), and the torpor (blue) and torpor+radiation (purple) groups which are clustered together, suggesting that the effects of torpor are more dominant than radiation exposure. |
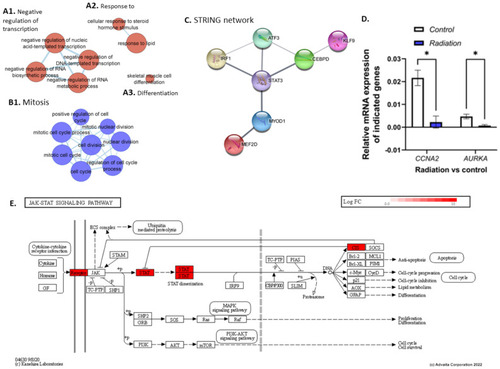
Clusters (A,B) were generated using EnrichmentMap and up (red) and downregulated (blue) genes, respectively. Cluster (A1) shows GO terms related to the negative regulation of transcription. (A2) shows a response to steroid hormone stimulus and lipids while (A3) shows skeletal muscle cell differentiation. (B1) shows downregulation of GO terms related to cell division. (C) shows a string network generated using the DNA transcription factor activity GO term (GO:0001216), showing protein interaction between STAT3 and MYOD1. (D) shows results from the qPCR analysis which shows significant downregulation of CCNA2 and AURKA in the radiation group compared with controls (28.5-rad vs. 28.5-Ctrl). (E) shows genes upregulated in the JAK/STAT pathway in the radiation vs control group. * p < 0.05. |

(A1) shows the upregulation of mitochondrial processes. (A2) shows the upregulation of GO terms involved in both protein metabolism and biosynthesis. (B1,B2) show the downregulation of developmental and cell cycle terms, respectively. (C) shows the upregulation of proteasomal subunit genes. (D) shows the qPCR analysis showing a significant upregulation of PSM8 and a non-significant upregulation of COX4I1. (E) shows the predicted inhibition of upstream regulator EZR. (F) shows the downregulation of genes involved in the ECM such as collagens, integrins, and fibronectins. * p < 0.05, ns = non-significant. |
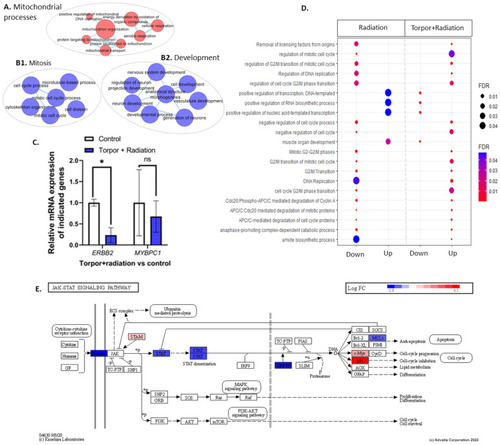
(A) shows an EnrichmentMap displaying upregulated GO terms related to mitochondrial processes. Clusters (B1,B2) show GO terms related to mitosis and development, respectively. (C) shows the qPCR analysis that details the significant downregulation of ERBB2 and non-significant decrease in MYBPC1. (D) shows GO terms dysregulated between the radiation group (28.5-Crtl) and the induced torpor+radiation group (18.5-mel-rad). (E) shows the downregulation of genes involved in the JAK/STAT pathways. * p < 0.05, ns = non-significant. |
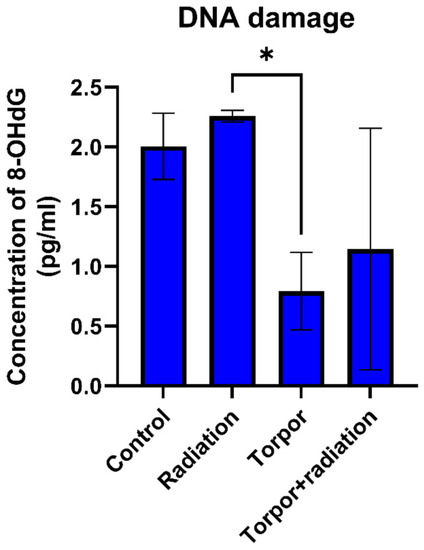
DNA damage for each experimental group. Levels of DNA damage were significantly lower in the torpor group versus the radiation group. * p < 0.05. |

(A) Heatmap depicting up and downregulated genes shared between the torpor group zebrafish model and hibernating bear gastrocnemius muscle. (B) Summary of shared GO terms in these groups. Notably, we find shared upregulation of genes involved in translation and amino acid metabolism, as well as shared downregulation of ECM and developmental genes. Created with BioRender.com. |