
FIGURE
Figure 6
- ID
- ZDB-FIG-230709-6
- Publication
- Cahill et al., 2023 - Transcriptome Profiling Reveals Enhanced Mitochondrial Activity as a Cold Adaptive Strategy to Hypothermia in Zebrafish Muscle
- Other Figures
- All Figure Page
- Back to All Figure Page
Figure 6
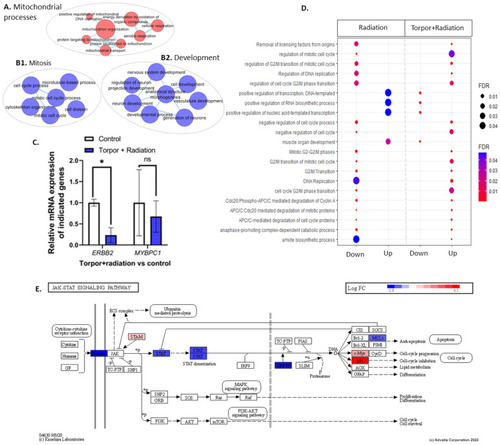
(A) shows an EnrichmentMap displaying upregulated GO terms related to mitochondrial processes. Clusters (B1,B2) show GO terms related to mitosis and development, respectively. (C) shows the qPCR analysis that details the significant downregulation of ERBB2 and non-significant decrease in MYBPC1. (D) shows GO terms dysregulated between the radiation group (28.5-Crtl) and the induced torpor+radiation group (18.5-mel-rad). (E) shows the downregulation of genes involved in the JAK/STAT pathways. * p < 0.05, ns = non-significant. |
Expression Data
Expression Detail
Antibody Labeling
Phenotype Data
Phenotype Detail
Acknowledgments
This image is the copyrighted work of the attributed author or publisher, and
ZFIN has permission only to display this image to its users.
Additional permissions should be obtained from the applicable author or publisher of the image.
Full text @ Cells