
FIGURE
Figure 3
- ID
- ZDB-FIG-230709-3
- Publication
- Cahill et al., 2023 - Transcriptome Profiling Reveals Enhanced Mitochondrial Activity as a Cold Adaptive Strategy to Hypothermia in Zebrafish Muscle
- Other Figures
- All Figure Page
- Back to All Figure Page
Figure 3
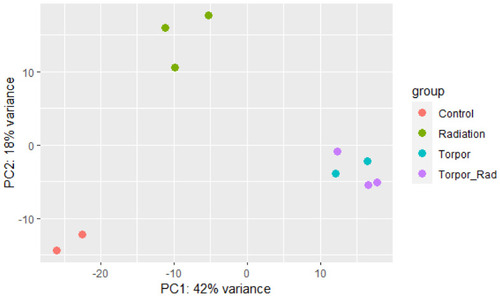
Principle component analysis plot showing samples of each experimental group clustering based on similarity. The plot shows distinct clustering between the control group (red), the radiation group (green), and the torpor (blue) and torpor+radiation (purple) groups which are clustered together, suggesting that the effects of torpor are more dominant than radiation exposure. |
Expression Data
Expression Detail
Antibody Labeling
Phenotype Data
Phenotype Detail
Acknowledgments
This image is the copyrighted work of the attributed author or publisher, and
ZFIN has permission only to display this image to its users.
Additional permissions should be obtained from the applicable author or publisher of the image.
Full text @ Cells