FIGURE SUMMARY
Title

Imaging Approaches to Investigate Pathophysiological Mechanisms of Brain Disease in Zebrafish

Authors
Turrini, L., Roschi, L., de Vito, G., Pavone, F.S., Vanzi, F.
Source
Full text @ Int. J. Mol. Sci.

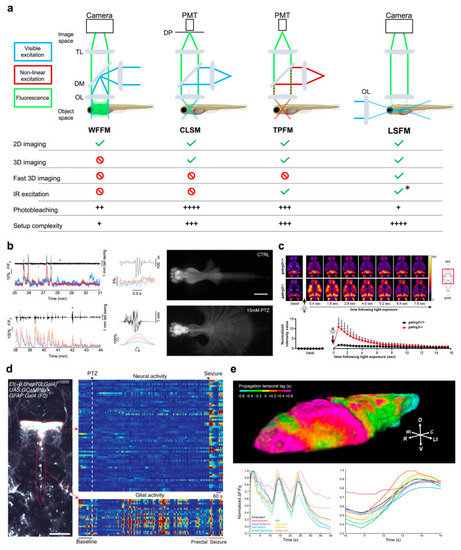
Functional imaging. (a) Top, schematics of the main imaging techniques adopted to perform functional imaging in zebrafish larvae: wide-field fluorescence microscopy (WFFM), confocal laser scanning microscopy (CLSM), two-photon fluorescence microscopy (TPFM), and light-sheet fluorescence microscopy (LSFM). Abbreviations: objective lens (OL), dichroic mirror (DM), tube lens (TL), photomultiplier tube (PMT), detection pinhole (DP). Bottom, table reporting the main imaging modalities achievable (green check) or not (red prohibition symbol) with each of the above techniques. The table also reports typical drawbacks (i.e., photobleaching and system complexity) quantified on a scale from one to four (black plus). Asterisk indicates that LSFM can employ IR excitation yet only in its multiphoton version. (b) Example of WFFM imaging performed on a pharmacological model of acute seizure. The wide field-of-view achievable with this technique enables to record calcium activity from four main brain districts (ΔF/F0 colored traces; telencephalon in blue, optic tectum in orange, cerebellum in yellow and hindbrain in purple) along with tail movements (black trace) in both physiological conditions (upper panels) and acute motor seizures (lower panels). Asterisks indicate the point of the traces shown, with expanded time scale, in the central panels of the figure. Images on the left represent maximum intensity projections of a motor behavior typical of physiological (upper) and pathological (lower) conditions. Scale bar: 500 μm. Figure adapted from [28], distributed under the terms of the Creative Commons Attribution License (CC-BY). (c) Representative single brain plane functional imaging performed using CLSM on GCaMP6f larvae expressing normal GABAA receptor (upper row) and larvae knockout for the γ2 GABAA receptor subunit (lower row). As visible in the temporal sequences and in the lower plot, knockout larvae (red data in the plot) show hyperexcitability to light which produces a transient seizure focused in the optic tectum. Figure taken from [36], distributed under the terms of the Creative Commons Attribution License (CC-BY). (d) Left, example of single-brain plane functional imaging using TPFM on larval zebrafish expressing GCaMP6s in thalamic neurons (upper red dotted outline) and periventricular glial cells (lower red dotted outline). Right, glial cells show increased activity (warmer colors) in the minutes preceding overt neuronal seizures. Scale bar: 100 μm. Figure taken from [39], distributed under the terms of the Creative Commons Attribution License (CC-BY). (e) Representative results obtained using 2P-LSFM whole-brain functional imaging on zebrafish larvae pan-neuronally expressing GCaMP6s. Above, 3D rendering of the temporal propagation dynamic of an ictal event during pharmacologically induced seizure. Colder and warmer colors represent regions reaching the peak of ictal activity earlier and later, respectively, with respect to the whole-brain average dynamic, as indicated by the color bar. Below, fluorescence traces highlighting the difference in temporal dynamic of the activity coming from different brain districts (color-coded as in the legend). Figure adapted with permission from [49] © The Optical Society.

Structural imaging. (a) Tree diagram reporting a classification of structural imaging methods. Abbreviations: antibodies (Ab), immunohistochemistry (IHC), immunofluorescence (IF), in situ hybridization (ISH), fluorescence in situ hybridization (FISH), optical coherence tomography (OCT), coherent anti-Stokes Raman scattering (CARS), third harmonic generation (THG). (b) Representative whole-mount ISH showing the spatial distribution of foxp2-positive neuronal populations into the developing zebrafish brain. Scale bars: 100 μm. Figure taken from [57], distributed under the terms of the Creative Commons Attribution License (CC-BY). (c) Activity maps (z-projections) obtained from whole mount immunofluorescence staining of pERK, used as a proxy of neuronal activity. Magenta indicates neurons with increased activity in the lights-off transition while green indicates those showing increased activity during lights-on transition. Compared to wild type, shank3ab mutants show normal activation of the pineal gland (P) but fail to show activation of the medulla oblongata (MO) and spinal cord (sc) during the lights-off transition. This indicates that shank3ab mutant models sense light normally but fail to activate downstream brain regions underlying sensorimotor integration. Scale bars: 50 μm. Figure taken from [58], distributed under the terms of the Creative Commons Attribution License (CC-BY). (d) Reporter line showing GABAergic (green) and glutamatergic (magenta) neurons and axonal projections (cyan) on both wild type and cntnap2ab mutant. The autism risk gene produces a significant reduction in GABAergic neurons in the telencephalon (white arrowheads). Figure reprinted from [20], with permission from Elsevier (please see Acknowledgements for details). (e) TEM micrographs of larval zebrafish spinal cord portion showing the increase in myelinated axons upon treatment with splitomicin. Red box in the cartoon on the right indicates the approximate spinal region where the micrographs were taken. Scale bar: 1 μm. Figure taken from [76], distributed under the terms of the Creative Commons Attribution License (CC-BY). (f) Representative polarization sensitive OCT acquisition of an adult zebrafish showing intensity (grays) and birefringence (colors) signals. Birefringence signal provides a measure of tissue organization (warmer colors, higher level of organization). For both signals, a sagittal cross section and two en face images at the position indicated by the dotted lines are presented. Figure adapted from [92], distributed under the terms of the Creative Commons Attribution License (CC-BY). (g) Polarization-resolved CARS imaging of a zebrafish larva allows the visualization of Mauthner axons. Different light polarizations (as indicated by double headed arrows) differently modulate CARS signals of myelin sheaths. Figure taken from [88], distributed under the terms of the Creative Commons Attribution License (CC-BY).

Behavioral imaging. (a) Schematic representation of the manifold behavioral imaging methods employed on zebrafish depending on the developmental stage and on the behavioral features to be studied. (b) High-throughput behavioral assay combining measurement of locomotor activity and calcium activity of the brain of 60 GCaMP6s larvae exposed to different pharmacological treatments in combination with PTZ. Image is a maximum intensity projection of a 13 min recording. Warmer colors indicate higher brain activity. Figure taken from [28], distributed under the terms of the Creative Commons Attribution License (CC-BY). (c) Behavioral imaging system specifically designed to study active/passive coping behavior in response to a stressor (electrical shock). Larval trajectories before (purple) and after (orange) shock are presented. The stressor produces an active-to-passive coping. Figure reprinted from [43], with permission from Elsevier (please see Acknowledgements for details). (d) Example of a three-chamber maze employed to evaluate social preference in a zebrafish line knockout for the gene katnal2. Mutant fish show impaired social preference with respect to wild type animals. Figure taken from [55], distributed under the terms of the Creative Commons Attribution License (CC-BY). (e) Example of an alternative maze employed on adult zebrafish treated with rotenone as a model of Parkinson’s disease. Heatmap overlays (the warmer the colors, the longer the time spent in that position of the maze) show that treated animals (third map from left) spent more time in the close arm than in the goal chamber with respect to untreated and vehicle animals (first and second map from left, respectively), indicating a decrease in cognitive abilities. Plots show an overall reduction in locomotor activity in treated animals with respect to both untreated and vehicle fish. Figure reprinted with permission from [140] © American Chemical Society. (f) Representative 3D tracking of adult zebrafish exposed to either anxiogenic (first plot from left) or anxiolytic (second plot from left) treatments. Fish treated with anxiogenic compound (alarm pheromone) display typical geotaxis behavior. Trajectories are color-mapped according to fish swim velocity (warmer colors indicate higher velocities). Figure taken from [142], distributed under the terms of the Creative Commons Attribution License (CC-BY). (g) Example of 3D trajectories of shoaling adult zebrafish. The first plot from left shows in different colors the swimming trajectories of a homogeneous quadruplet of control fish. The second plot shows trajectories of a heterogeneous quadruplet composed by three control fish and one zebrafish (blue line) treated with a compound mimicking behavioral features of autism/schizophrenia. Heterogeneous quadruplet does not show increased locomotor activity with respect to a homogeneous one. However, treated fish swim far apart from control ones and typically also produce a reduced cohesion of the shoal (increased interindividual distance in the heterogeneous quadruplet). In the bar plot, white refers to a homogeneous shoal while black to a heterogeneous one. Figure adapted from [144], distributed under the terms of the Creative Commons Attribution License (CC-BY).

Acknowledgments
This image is the copyrighted work of the attributed author or publisher, and ZFIN has permission only to display this image to its users. Additional permissions should be obtained from the applicable author or publisher of the image. Full text @ Int. J. Mol. Sci.