IMAGE

Figure 2

ID
ZDB-IMAGE-230630-34
Source
Figures for Turrini et al., 2023
Image
Figure Caption

Figure 2

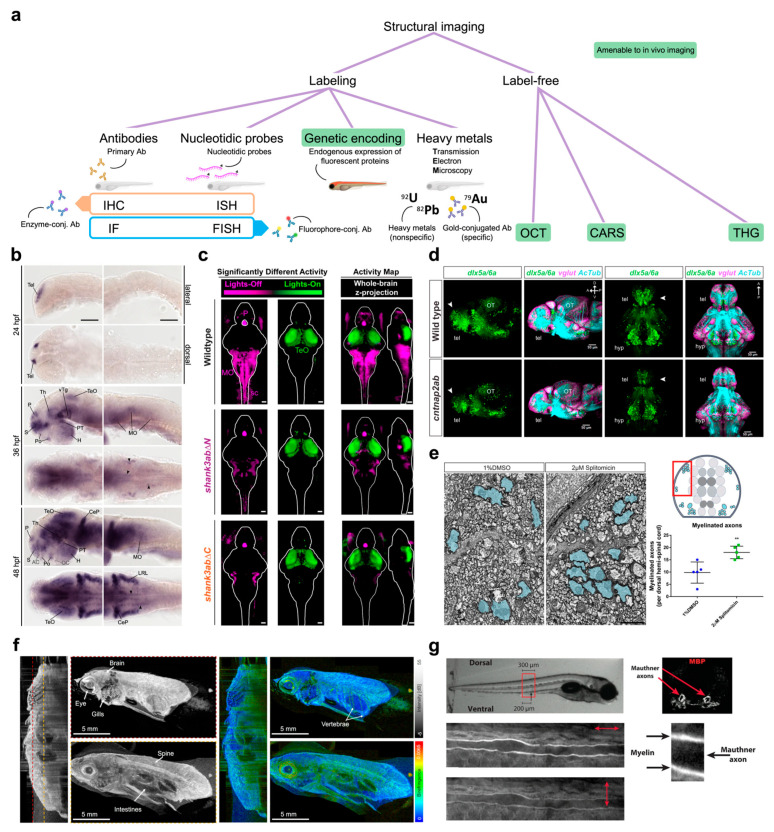
Structural imaging. (a) Tree diagram reporting a classification of structural imaging methods. Abbreviations: antibodies (Ab), immunohistochemistry (IHC), immunofluorescence (IF), in situ hybridization (ISH), fluorescence in situ hybridization (FISH), optical coherence tomography (OCT), coherent anti-Stokes Raman scattering (CARS), third harmonic generation (THG). (b) Representative whole-mount ISH showing the spatial distribution of foxp2-positive neuronal populations into the developing zebrafish brain. Scale bars: 100 μm. Figure taken from [57], distributed under the terms of the Creative Commons Attribution License (CC-BY). (c) Activity maps (z-projections) obtained from whole mount immunofluorescence staining of pERK, used as a proxy of neuronal activity. Magenta indicates neurons with increased activity in the lights-off transition while green indicates those showing increased activity during lights-on transition. Compared to wild type, shank3ab mutants show normal activation of the pineal gland (P) but fail to show activation of the medulla oblongata (MO) and spinal cord (sc) during the lights-off transition. This indicates that shank3ab mutant models sense light normally but fail to activate downstream brain regions underlying sensorimotor integration. Scale bars: 50 μm. Figure taken from [58], distributed under the terms of the Creative Commons Attribution License (CC-BY). (d) Reporter line showing GABAergic (green) and glutamatergic (magenta) neurons and axonal projections (cyan) on both wild type and cntnap2ab mutant. The autism risk gene produces a significant reduction in GABAergic neurons in the telencephalon (white arrowheads). Figure reprinted from [20], with permission from Elsevier (please see Acknowledgements for details). (e) TEM micrographs of larval zebrafish spinal cord portion showing the increase in myelinated axons upon treatment with splitomicin. Red box in the cartoon on the right indicates the approximate spinal region where the micrographs were taken. Scale bar: 1 μm. Figure taken from [76], distributed under the terms of the Creative Commons Attribution License (CC-BY). (f) Representative polarization sensitive OCT acquisition of an adult zebrafish showing intensity (grays) and birefringence (colors) signals. Birefringence signal provides a measure of tissue organization (warmer colors, higher level of organization). For both signals, a sagittal cross section and two en face images at the position indicated by the dotted lines are presented. Figure adapted from [92], distributed under the terms of the Creative Commons Attribution License (CC-BY). (g) Polarization-resolved CARS imaging of a zebrafish larva allows the visualization of Mauthner axons. Different light polarizations (as indicated by double headed arrows) differently modulate CARS signals of myelin sheaths. Figure taken from [88], distributed under the terms of the Creative Commons Attribution License (CC-BY).

Acknowledgments
This image is the copyrighted work of the attributed author or publisher, and ZFIN has permission only to display this image to its users. Additional permissions should be obtained from the applicable author or publisher of the image. Full text @ Int. J. Mol. Sci.